
Tyler Technologies (NYSE:TYL) delivered second-quarter 2019 non-GAAP earnings of $1.30 per share, which matched the Zacks Consensus Estimate. Meanwhile, the bottom-line result increased 10.2% from the year-ago period.
Albeit net sales improved 16.9% on a year-over-year basis to $278 million in the quarter, the same came in line with the consensus mark. Tyler recorded organic sales growth of 7.4% for the reported quarter.
The company is benefitting from the surging SaaS adoption amid local governments. Investments and acquisitions are helping it improve its competitive edge and address new and expanding opportunities.
Delving Deeper Into Q2 Results
Recurring revenues including software maintenance and subscription revenues increased 20.8% year over year, comprising 65.5% of the total revenue base.
Tyler’s subscription revenues (26.7% of total) for the quarter surged 38.6% to $73.5 million. The company also added 154 subscription-based arrangements, up from 126 a year ago. Further, it had 27 existing on-premises client conversions (32 in the year-ago quarter), representing approximately $128 million ($32 million a year earlier) in total contract value.
Subscription contract value comprises 80% of total new software contract value signed during the quarter compared with 47% in the prior-year period.
Included in Subscriptions are Transaction-based revenues from e-filing and online payments, which rose 26.7% to $21.2 million. Further, e-filing revenues of $14.5 million grew 13.8%.
Tyler’s Software Services revenues (20.9%) of $25.8 million climbed 13.3%. While maintenance revenues (38.7%) of $106.7 million ascended 11%. Hardware and other revenues (3.9%) too augmented 27.3% to $10.7 million.
Appraisal services revenues (2.3%) fell 12.7% to $6.2 million. Software licenses and royalties (7.5%) of $20.7 million declined 7.7% on a year-over-year basis as well.
Backlog at the end of the quarter was $1.43 billion, up 17%. Of this, software-related backlog increased 17.4% to $1.395 billion.
Bookings soared 72.3% to $452 million. This upside can be attributed to the two large SaaS deals the company snapped up in the quarter, valued at $85 million and $20 million each. However, management added that given these two plum deals, the company may have to face a tough year-over-over comparison in the second quarter of 2020.
The buyouts of MicroPact and Socrata contributed slightly more than $23 million to the quarterly results.
Tyler Technologies, Inc. Price, Consensus and EPS Surprise
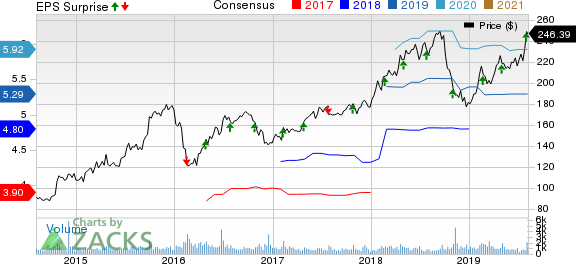
Tyler Technologies, Inc. price-consensus-eps-surprise-chart | Tyler Technologies, Inc. Quote
Margins
Tyler’s non-GAAP gross profit improved 19.1% year over year to $142.5 million. Moreover, non-GAAP gross margin expanded 90 basis points (bps) to 51.2%.
Although the company’s non-GAAP operating income increased 10.1% year over year to $68.4 million, its operating margin contracted 150 bps to 24.6%.
Adjusted EBITDA was $74.6 million, up 10.3% year over year.
Balance Sheet and Cash Flow
Tyler exited the quarter with cash and cash equivalents of $11.2 million, down from $39.4 million at the end of the sequential quarter.
The company generated $24.5 million of cash flow from operational activities compared with $27.3 million in the first quarter.
Guidance
Tyler reiterated its revenue outlook for 2019. Non-GAAP total revenues are expected in the range of $1.09-$1.11 billion.
For 2019, the company continues to expect non-GAAP earnings per share in the band of $5.22-$5.35, tightened from $5.20-$5.35 predicted earlier.
The acquisition of Micropact in the first quarter is expected to fortify the company’s footprint in the Federal business, leading to a strong third quarter.
However, the repetition of large deal signings is uncertain. The company anticipates to witness normal mix of some large deals and a normal mix of more traditional mid-sized deals in the rest of 2019.
Zacks Rank and Stocks to Consider
Tyler currently carries a Zacks Rank #3 (Hold). A few better-ranked stocks in the broader technology sector are Rosetta Stone (NYSE:RST) , LogMeIn (NASDAQ:LOGM) and Perficient (NASDAQ:PRFT) , each flaunting a Zacks Rank #1 (Strong Buy). You can see the complete list of today’s Zacks #1 Rank stocks here.
Long-term earnings growth rate for Rosetta Stone, LogMeIn and Perficient is currently projected to be 12.5%, 5% and 10.8%, respectively.
This Could Be the Fastest Way to Grow Wealth in 2019
Research indicates one sector is poised to deliver a crop of the best-performing stocks you'll find anywhere in the market. Breaking news in this space frequently creates quick double- and triple-digit profit opportunities.
These companies are changing the world – and owning their stocks could transform your portfolio in 2019 and beyond. Recent trades from this sector have generated +98%, +119% and +164% gains in as little as 1 month.
Click here to see these breakthrough stocks now >>
Tyler Technologies, Inc. (TYL): Free Stock Analysis Report
Perficient, Inc. (PRFT): Free Stock Analysis Report
LogMein, Inc. (LOGM): Free Stock Analysis Report
Rosetta Stone (RST): Free Stock Analysis Report
Original post
Zacks Investment Research