Summary- This week, the BEA released the first estimate of 3Q GDP, which showed continued increases.
- PCEs are up across the board, as is government spending.
- Investment increased, but only in IP spending; companies are slowing their physical investment.
The purpose of the Turning Points Newsletter is to look at the long-leading, leading, and coincidental indicators to determine if the economy has shifted from expansion to contraction - if the economy has reached a "turning point."
This week, the BEA released another solid GDP report. As this is the most comprehensive coincidental data of the economy available, I thought it would be appropriate to look at the report's components from several different perspectives to try and figure out why there's been a change in economic velocity - or, at least, to see where the changes have happened.
Remember that unemployment is very low and that other measures of employment (save for wages) are printing some of their best numbers in decades (please see the Atlanta Fed's Labor Market Spider Chart for further information). Congress has also acted in two important ways: it's lowered taxes and increased spending, both of which fuel growth. The combination of these three events would be enough to move the aggregate demand curve or the IS curve to the right, increasing potential GDP.
Let's look at each sub-category of the GDP report, starting with PCEs:
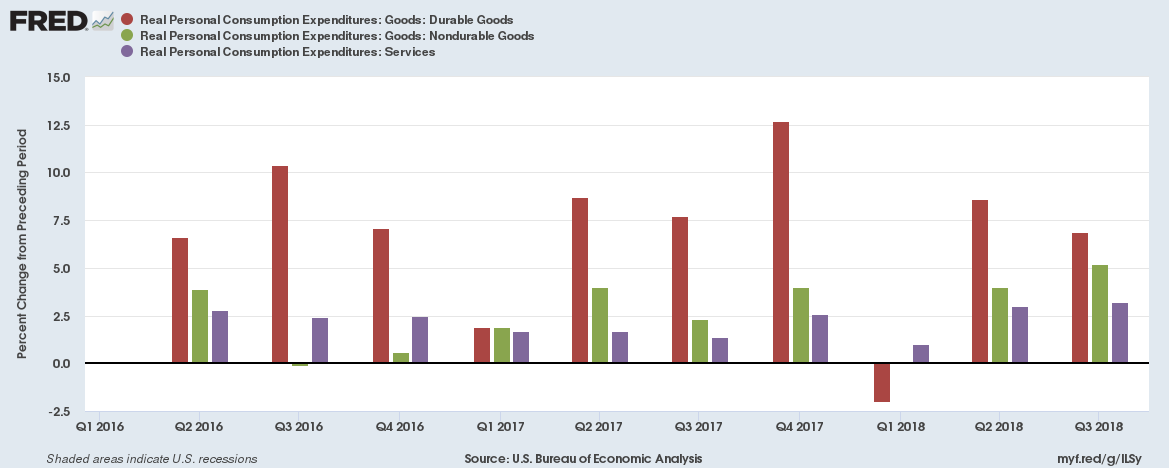
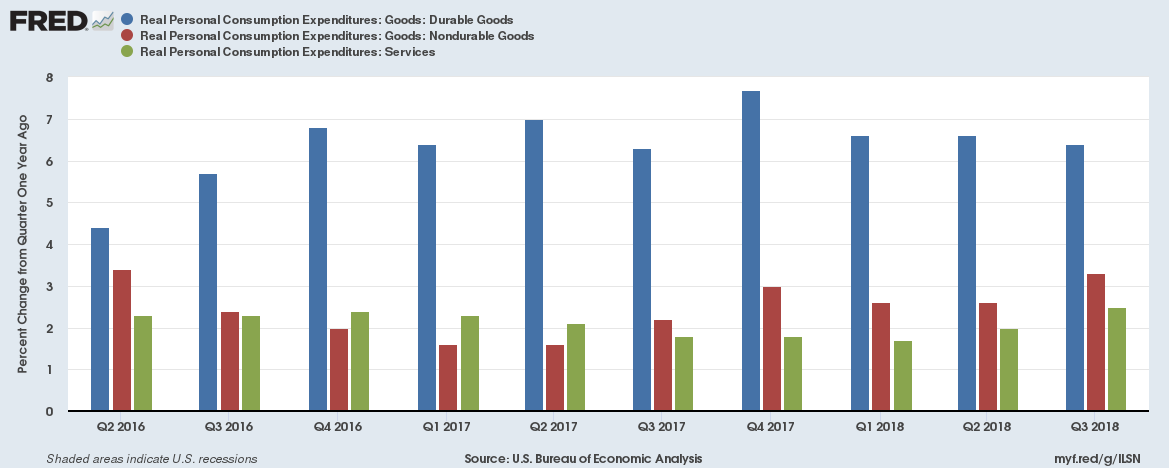
Above is the quarterly growth rate of each sub-category of PCE spending - durable goods (in red), non-durable goods (in green) and services (in purple). Simply eyeballing this graph, notice that durable good spending is a touch lower but that both non-durable and service spending are modestly higher. In other words, consumers are now spending their money on a larger number of goods, which we see in this chart of the Y/Y percentage change in each sub-group:
Non-durable spending started to increase at a faster pace four quarters ago; service spending is modestly higher in the last two.
Finally, consider this graph:
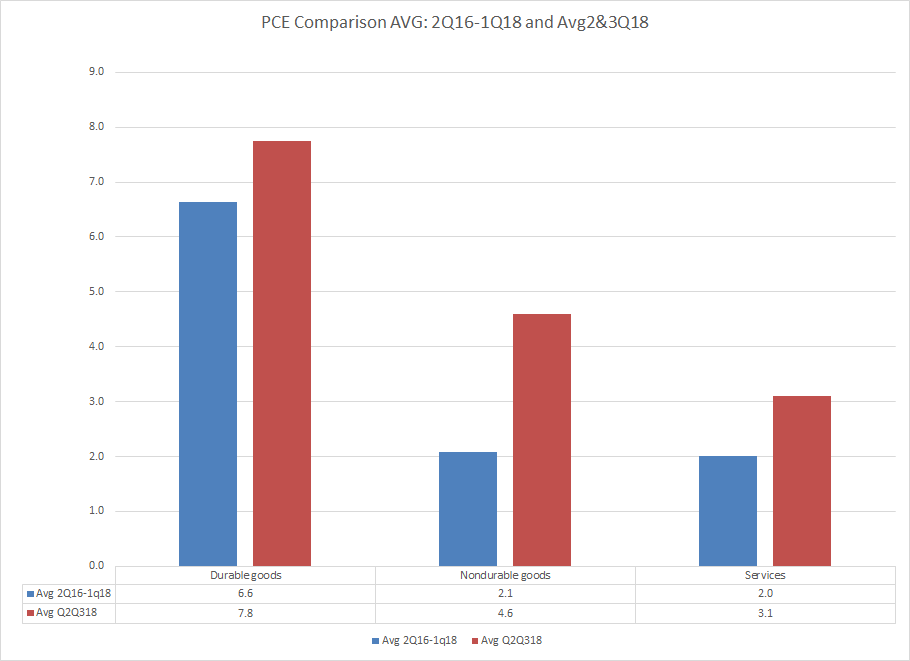
What I've done is to take the average of the quarterly growth from 2Q16-1Q18 - which are the eight quarters before the 2Q18. I'm working on the assumption that the TCJA and fiscal stimulus started to work their way into the economy by 2Q18, which would partially explain the bump in growth the last two quarters. PCEs have definitely increased the last two quarters relative to the average of the preceding eight. What's most interesting is the nearly doubling of non-durable consumption. The full percentage point increase in service expenditures is also interesting.
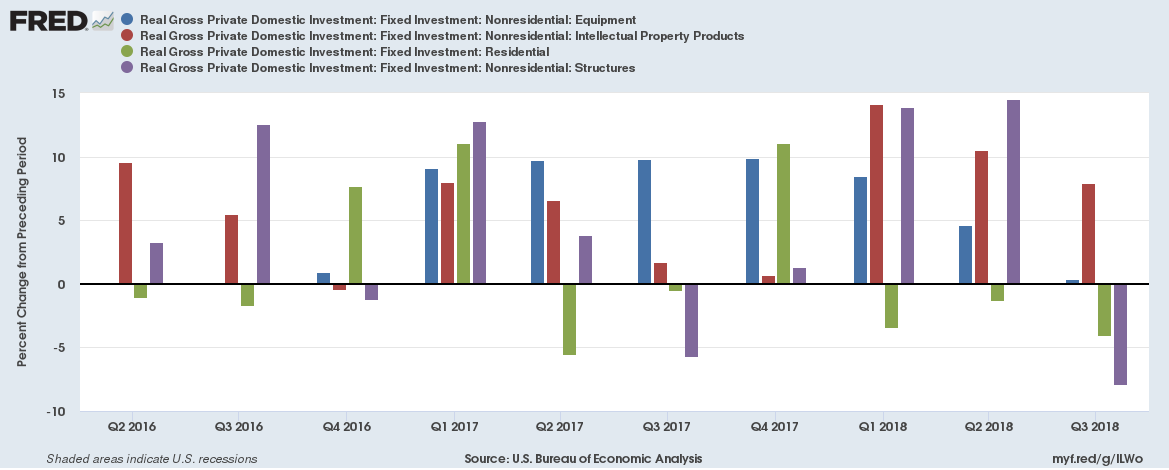
Next, let's look at investment spending, starting with the Q/Q chart from the St. Louis FRED system:
The above data jumps around, so let's take it systematically, starting with equipment investment in blue. This was strong for 2017 but actually weakened the last two quarters. IP spending growth (in red) was especially strong the last three quarters. Residential investment (green) contracted the last three months; CRE spending (in purple) expands and contracts in waves.
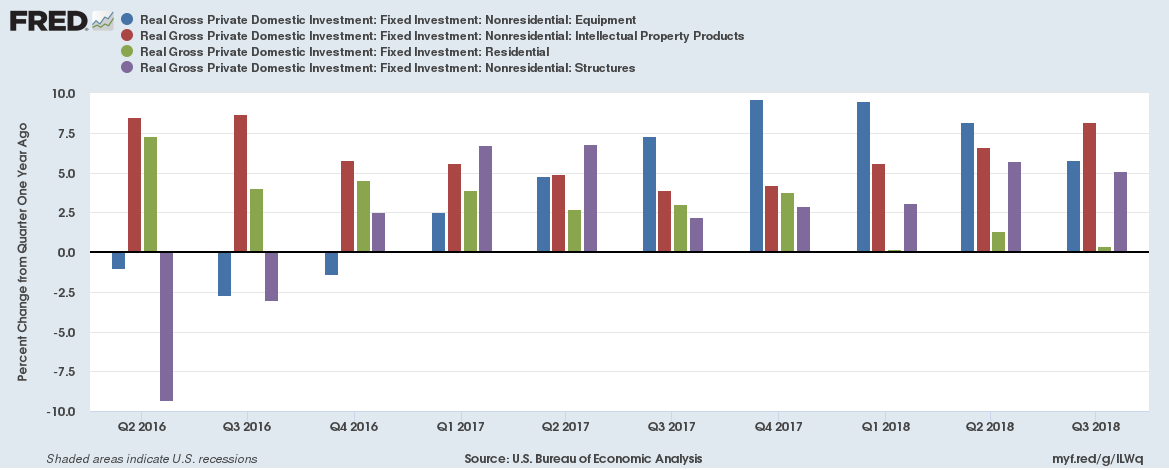
Let's look at the same data from a Y/Y perspective:
Remember that the purpose of Y/Y analysis is to remove seasonal impacts from the analysis. Here, equipment (in blue) and IP spending (in green) is far more consistent. Residential spending (in green) is still weak in the last three quarters, but CRE spending (purple) rose the last two quarters.
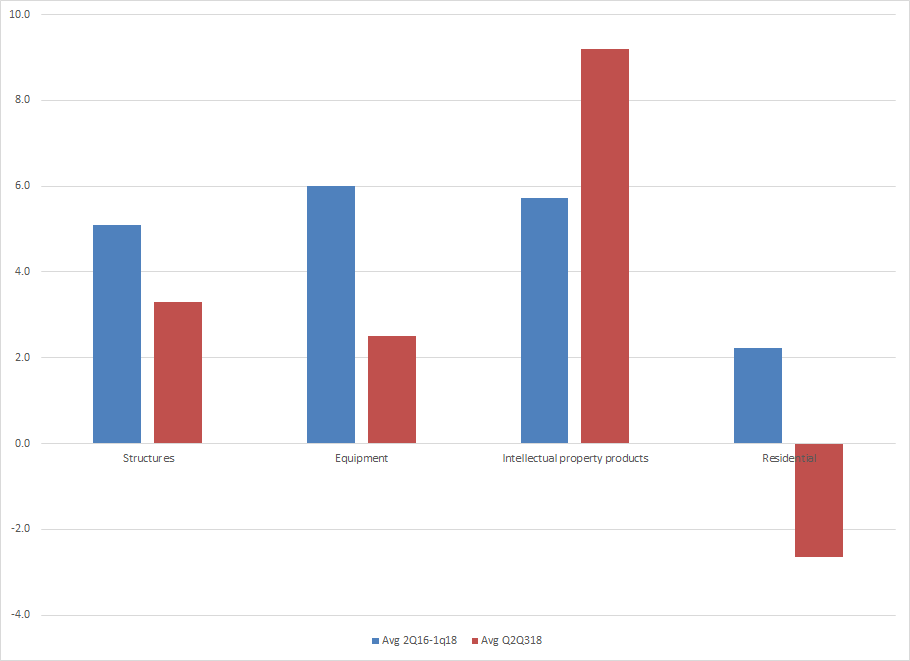
Finally, let's use the same average analysis that we used in the PCE section:
Three areas of investment spending (structures, equipment, and residential) are on average lower than the preceding eight quarters. The large bump in IP spending is very interesting. I have a suspicion this has to do with the TCJA act. It's easier to plow extra money into IP spending, especially in comparison to physical projects. Trade issues are probably hurting sentiment, lowering physical investment.
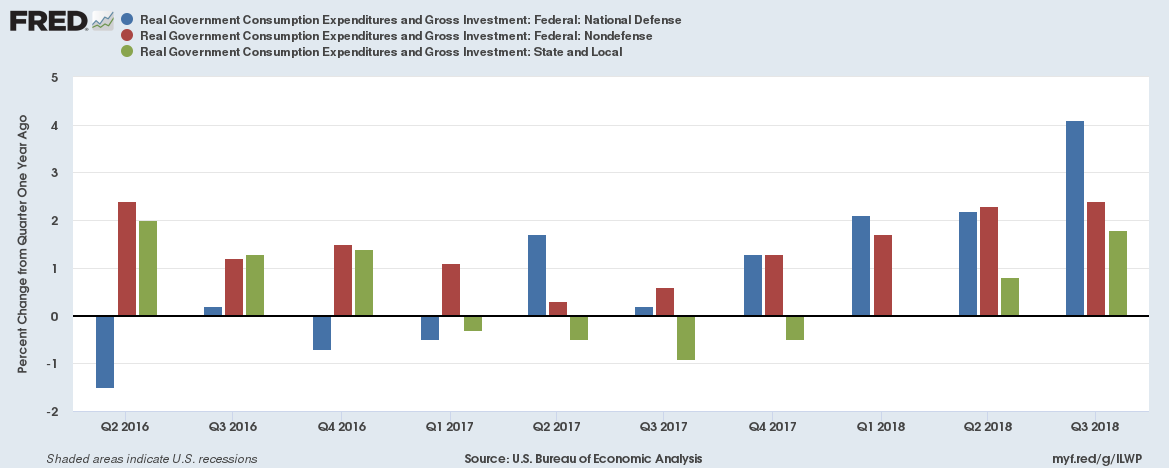
Despite the increase in trade tensions, exports and imports have been remarkably constant. So, I want to turn to this chart of the Y/Y percentage change in government spending:
National defense spending (in blue) started to ramp up in 4Q17 and really started to increase sharply in the last three quarters. So did non-defense (in red) federal spending. Even state and local spending (in green) added to the increase.
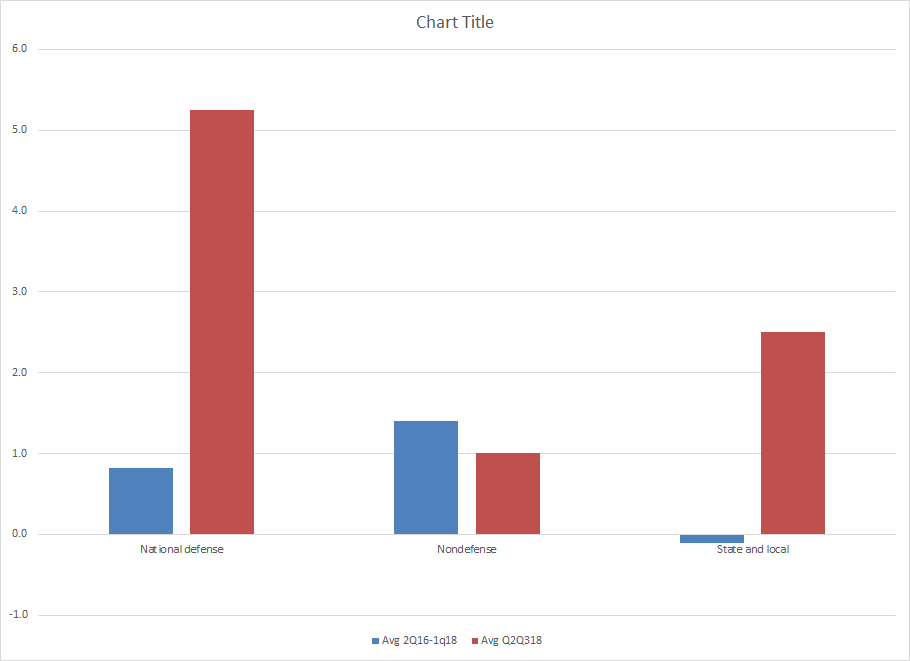
Finally, let's look at the last two quarters and the preceding eight:
Note the huge increase in defense spending. Nondefense spending is actually down a bit but state and local spending ramped up sharply.
It's possible that we're seeing peak growth. Tax cuts usually have their strongest impact within the first 2-3 quarters after passage while fiscal spending depends on Congress' mood during budget negotiations. I think the big issues going into the fourth quarter are: how strong will holiday spending be; will business spending on non-IP investment increase; and will we start to see a bigger negative impact on trade? Until then, enjoy the good numbers.
Disclosure:I/we have no positions in any stocks mentioned, and no plans to initiate any positions within the next 72 hours.
I wrote this article myself, and it expresses my own opinions. I am not receiving compensation for it (other than from Seeking Alpha). I have no business relationship with any company whose stock is mentioned in this article.

