Summary- Durable goods orders returned to positive territory this month.
- Corporate profits continue to increase.
- The latest GDP numbers were very strong.
The purpose of turning points is to analyze long-leading, leading, and coincident economic indicators to determine if the economy is about to change from expansion to contraction - to see if the economy is at a "Turning Point."
Leading Indicators
This week, several government statistics bureaus released key information, starting with the Census Bureau's monthly durable goods report:


The top graphics are from the release. The upper right graph shows that the headline number has been weak the last few months, but that this month's result rebounded into positive territory. The lower-left chart shows two trends in the data. The first is a sideways movement between 240,000-240,000 million between 2013-2017. The headline number started to increase at the beginning of 2017, which corresponded to a commensurate rise in the US ISM data. The lower right chart shows that the Y/Y percentage change turned strongly positive starting in 1Q17. While this number has recently declined, remember it's a volatile series, so the wide swings shouldn't be surprising.
There are two subsets of the durable goods data that are positive:


The top two charts show the absolute number for non-defense capital goods while the upper-right chart places that data into a Y/Y context. This is another way of saying, "machinery." This number is in a solid uptrend. The same is true for consumer durable goods numbers, which are in the bottom two charts. This ties into the latest GDP data that continues to show strong consumer durables activity.
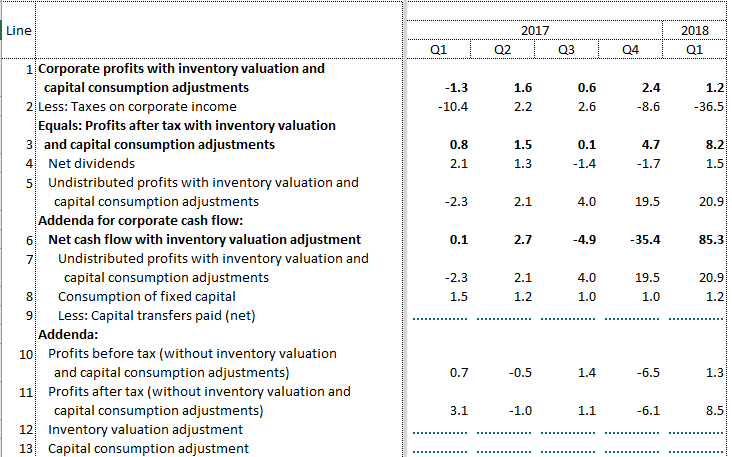
Secondly, the BEA's GDP release contained updated corporate profit information, which is contained in the following table that shows Q/Q numbers:

These are only for the 1Q17, but they're good numbers. Pay particular attention to the second emboldened number of 8.2%, which shows the impact of the TCJA passed at the end of last year.
Leading Indicators Conclusion: both of these numbers are positive and point towards continued growth.
Coincidental Numbers
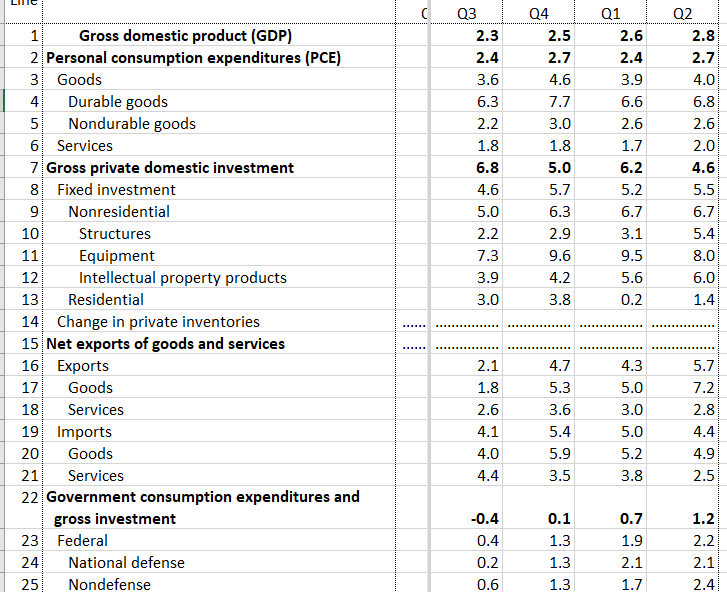
Friday, the BEA released the latest GDP numbers. The following table from the report shows the Y/Y percentage change in the various categories:

While the headline number was a 4.1% annualized pace of growth, the Y/Y percentage change (which strips out seasonality effects) was a more modest 2.8%. Despite that, there's a lot to like in the report's details. First, consumers are still spending. And they're buying durable goods at a Y/Y 6.8% clip, which means they're feeling good about the future. The pace of non-durable goods and service numbers are solid. Fixed investment is also doing well. Notice the acceleration in nonresidential structure investment (which rose 5.4%) and continued strong performance for equipment investment. There was a big pick-up in exports, which probably occurred as foreign business pulled sales forward due to impending tariffs. Finally, increased government spending at the federal level certainly helped as well.
Coincidental Data Conclusion: the latest GDP report puts the US economy on solid ground.
Disclosure: I/we have no positions in any stocks mentioned, and no plans to initiate any positions within the next 72 hours.
I wrote this article myself, and it expresses my own opinions. I am not receiving compensation for it (other than from Seeking Alpha). I have no business relationship with any company whose stock is mentioned in this article.
