Summary- The labor market is in great shape.
- Consumers are spending at a solid clip.
- Industrial production is very strong.
The purpose of the Turning Points Newsletter is to analyze long-leading, leading, and coincidental economic data to determine if the economy is changing from expansion to contraction - to see if we're at a macroeconomic "Turning Point."
Leading Indicators
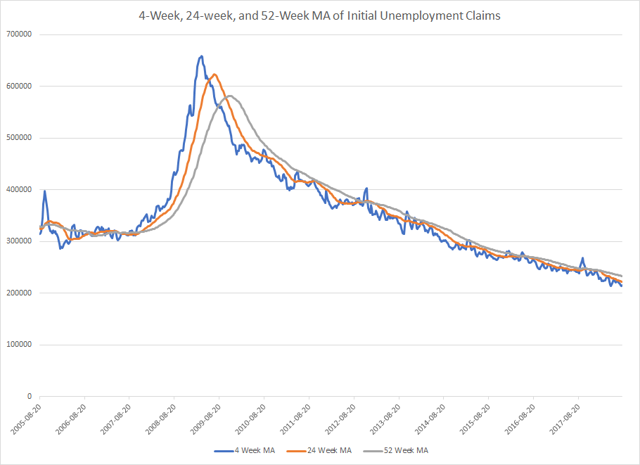
Let's start this week by looking at initial unemployment claims:
The above chart contains a lot of data. First is the 4-week moving average in blue, which smooths out the weekly data. To further smooth out the data, I've added the 24-week (in orange) and 52-week (in gray) moving average of the 4-week number. What we're looking for is a divergence between the 4-week number and the longer moving averages. Instead, all three are moving lower with the 4-week number below the longer averages. This is about as healthy as it gets in the labor market.
Next, let's turn to building permits. This week, the Census released the latest data:
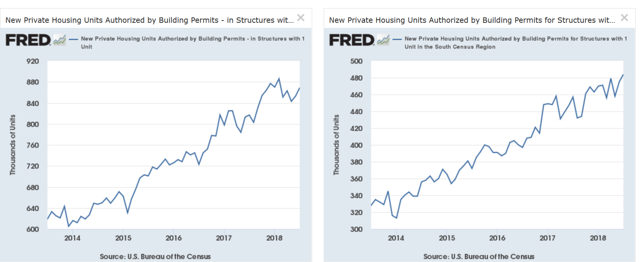
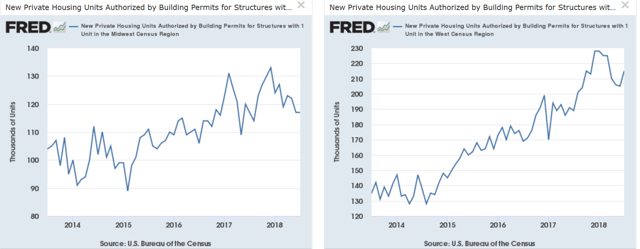
Let's look at the numbers in graphical format:
The left chart shows the national number. It turned higher in the latest report after drifting lower for most of 2018. The 5-year trend is up. The right chart shows the South Census region, which accounts for 55% of the national figure. That region saw an increase last month - another positive development.
The left chart shows the Midwest figure (13% of the national figure) which was flat last month. The right chart shows West's figure (25% of the national number), which, like the Southern region, turned higher last month. The West's move lower for the last few months was a primary reason for weakness in this data since the first of the year.
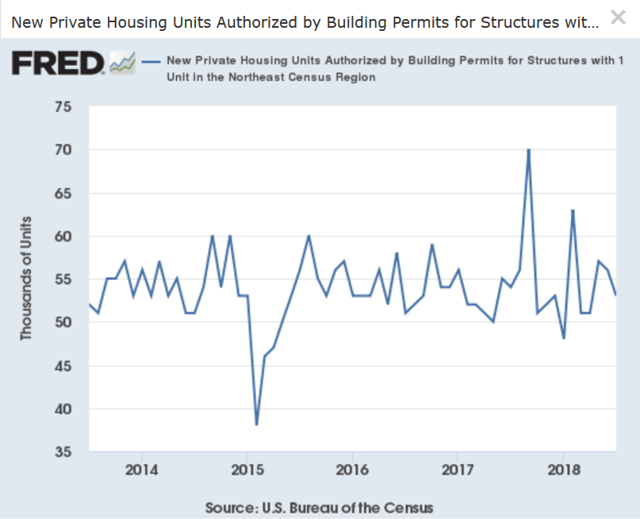
And finally, here's the NE region's data:
This region only accounts for 6% of the national total, so it's really an afterthought to the data. It's been moving sideways for the last five years.
The conclusion from the leading numbers: The labor market is in fantastic shape; with the exception of wages, it couldn't be better. And the housing market is pointing towards further growth. The leading indicators show a continued expansion for the next 6-12 months.
This week, two coincidental numbers were released. Let's start with retail sales:
Let's look at two key charts from the report:
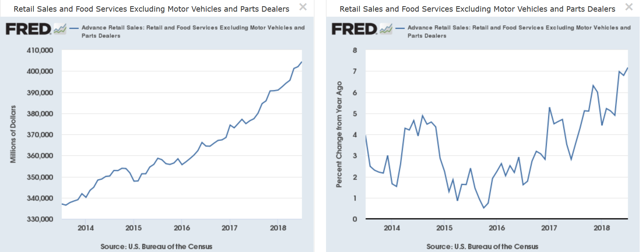
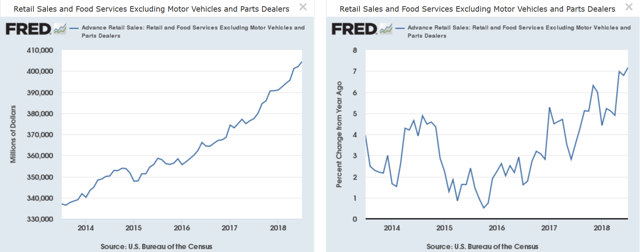
The top chart shows the overall number. The left chart is the total aggregate amount while the right chart is the Y/Y figure. The bottom two charts show the data ex-auto sales. The left charts are very strong: they move from the SW to the NE. The right charts for both indicate that the Y/Y numbers for both are at 5-year highs. It really couldn't be any better.
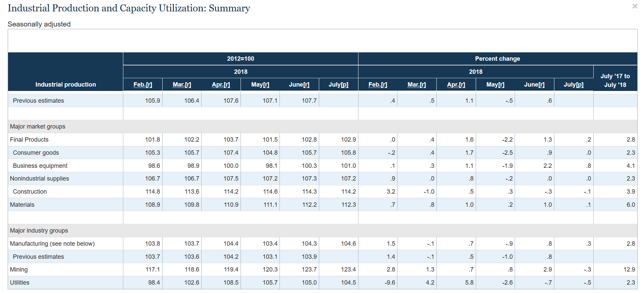
Finally, here is the latest industrial production data from the Federal Reserve:
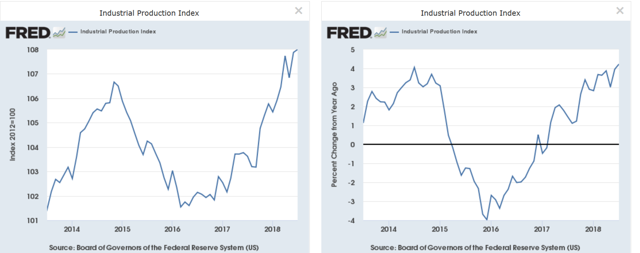
The data is largely positive. There's a modest dip in construction supplies. Mining is off a bit, but it is prone to wilder fluctuations. Utilities are weak, but they've been weak for most of this expansion. However, the top-line graph is great:
Industrial production is at a 5-year high; the Y/Y number is near that level.
Coincidental indicators conclusion: The data shows that right now the economy is doing very well.
Overall, there is nothing in the data to indicate we're near a turning point economically.
Disclosure: I wrote this article myself, and it expresses my own opinions. I have no business relationship with any company whose stock is mentioned in this article.

