Actionable ideas for the busy trader delivered daily right up front
- Tuesday higher if ES stays above pivot, else lower, low confidence.
- ES pivot 1417.33. Holding above is bullish.
- Rest of week bias uncertain technically.
- Monthly outlook: bias uncertain.
- ES Fantasy Trader standing aside.
Well after submerging in the pre-dawn hours (but that doesn't count) ES broke above its pivot in convincing fashion exactly at the open Monday morning and that was that. Despite sagging somewhat later in the day, we still managed to pull out a win, meager as it was, with the Dow gaining 15 points. Forget pyramid power folks, pivot power is where it's at. So one day down in Interesting Week and four to go. Now let's put all the charts on the 5:12 to Glendale and see where they get off.
The technicals (daily)
The Dow: The Dow's slim gain today kept it inside the rising RTC but with a spinning top. The indicators are beginning to look weak here. RSI has peaked at overbought, money flow is highly overbought at 79.08, and the stochastic is leveling out to form a bearish crossover. So although I can't immediately call this chart lower, I'd guess we'll see a drop in a couple of days at the most. Right now the upper BB at 13,253 is looking out of reach.
The VIX: Another funny day here - the VIX gained 0.94% but did it on a long red closing marubozu. So despite the numeric gain, the pattern doesn't look particularly bullish. In fact we remain inside a surprisingly good descending RTC (Pearson's = 0.941) and the indicators are nowhere near oversold. So I'd not be surprised at all to see the VIX move lower again on Tuesday.
Market index futures: Tonight all three futures are down at 1:20 AM EST with ES lower by 0.19%. Today's continued gains were the payoff for yesterday's three white soldiers pattern I mentioned. They kept us inside the rising RTC. But - with the RTC rising so steeply, it didn't take much to fall off the right side and that's what's happening now. We're really just clinging to the edge here. And the indicators are ambivalent too, with RSI. money flow, and OBV heading lower, but momentum and the stochastic moving higher. This sort of indecision is typical of a pre-Fed day.
ES daily pivot: Tonight the pivot rises from 1415.58 to 1417.33. The drop in ES after the close plus the rise in the pivot lands us smack on top of the new number. Right now as I write, ES is teetering on the edge trying to decide which side to come down on, with an ever so slight edge to the bulls.
Dollar index: The bearish evening star I spoke of last night completed today with a 0.09% gap down for the dollar. Although the indicators are still not quite overbought, I'd not be wanting to place any long bets on the dollar in the face of a chart like this right now, especially considering the state of the euro (see next).
Euro: Looks like the euro decided to completely ignore what's 'is name's resignation in Italy as it posted strong gains today with continued upside i the overnight, now at 1.2958 following a big pop at 11:20 PM caused by, um, well nothing really jumps out at me on the news wires right now. That's why I like technical analysis - I don't have to spend a lot of time reading news articles all day long. The important point is that this move took the euro out of its latest descending RTC for a bullish setup. Unless the euro closes below 1.2859 on Wednesday (which seems unlikely), further upside will no doubt follow and that should be good for the markets.
Transportation: And on a very positive note, the trans on Monday took a 1.08% pop to bust through resistance at 5150 and come close to their upper BB at 5212. We now have a clearly defined rising RTC, support at the 200 day MA and 5150, a completed bullish stochastic crossover, and rising indicators that are not yet overbought. No bearish signs here, folks.
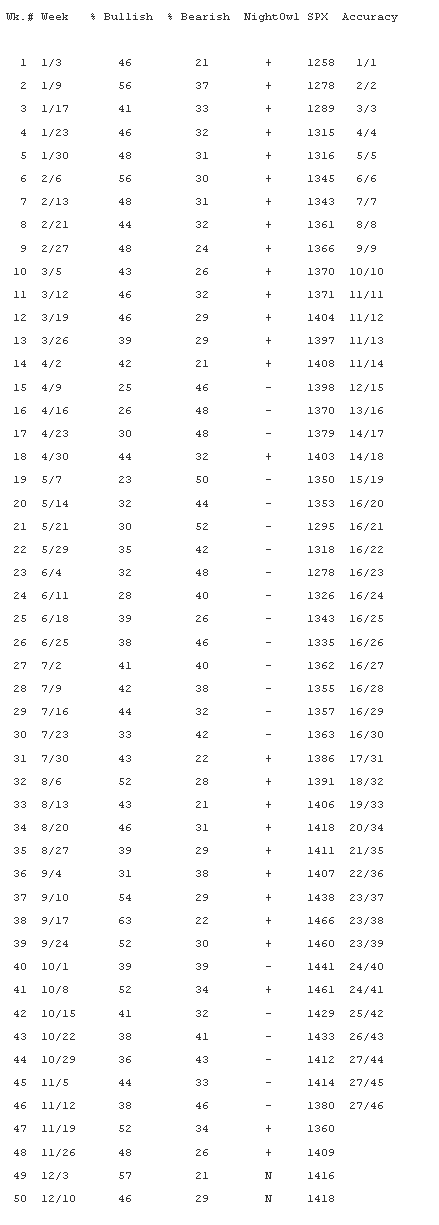
Sentiment: Once again it's time for the latest weekly TickerSense Blogger Sentiment Poll. We continue to track the poll to see how well it performs. Here's the updated cumulative list for this year (it's getting pretty long):
Again, the SPX number is the closing price of the S&P on the Friday before each new poll comes out. The "NightOwl" column is how I voted. Since the poll is for 30 days out, after the first four weeks we're able to see how well we did. This week we see that my bearish call on 11/12 was wrong, the S&P now being higher than then. I'm using the column "Accuracy" to track my calls. So now with just two weeks to go in 2012, I'm 27 for 46 or 59%.
It's interesting to see how in the space of one week, the spread in sentiment narrowed considerably. Personally I'm sitting on the sidelines again for the second week in a row and it looks like I've got company. Still waiting for the fiscal cliff to resolve.
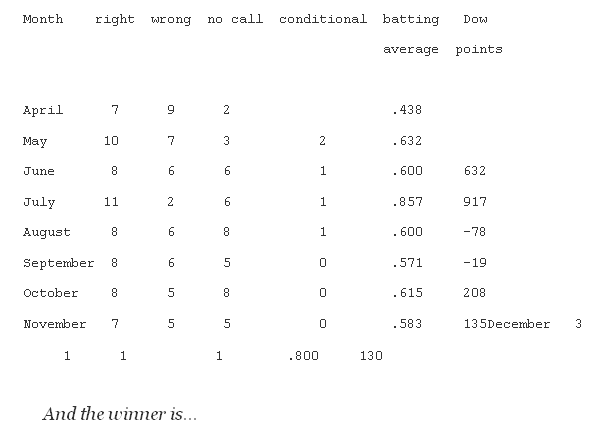
Accuracy (daily calls): 
It's looking to me like the market is already pricing in some good news ahead of the Fed on Wednesday, so I think Tuesday's pretty much going to be a wait & see day. Technically, the charts are still in pretty good shape, so I'm going to make another conditional call. If ES stays above its pivot by mid-morning Tuesday, we close higher, else lower. Either way though I'm not expecting any big moves on Tuesday. 
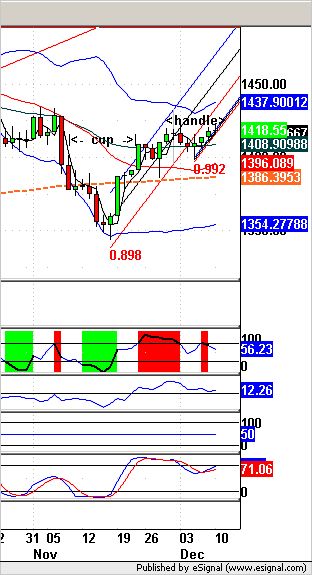
Oh yes, and let me add that while the SPX failed to take out 1420 again on Monday, it does have a bullish stochastic crossover going for it and remains in a rising RTC, so all hope is not lost. And while we're on the subject - am I the only one seeing a developing cup & handle in the daily SPX chart? That's one of the best bullish patterns out there. Take a look here and see if you don't agree.
ES Fantasy Trader
Portfolio stats: the account remains at $188,750 after 73 trades (57 wins, 16 losses) starting from $100,000 on 1/1/12. Tonight we stand aside in the face of continuing uncertainty and the expectation of minimal rewards.
