S&P 500 Futures: Up 106 Handles From Wednesday Nights Globex Low
The S&P 500 Futures rallied 106 handes (points) from Wednesday nights Globex session low to Fridays high. This type of movement has become commonplace since the U.S. / China tariff headline news algo programs have dominated the overall price action of the stock market.
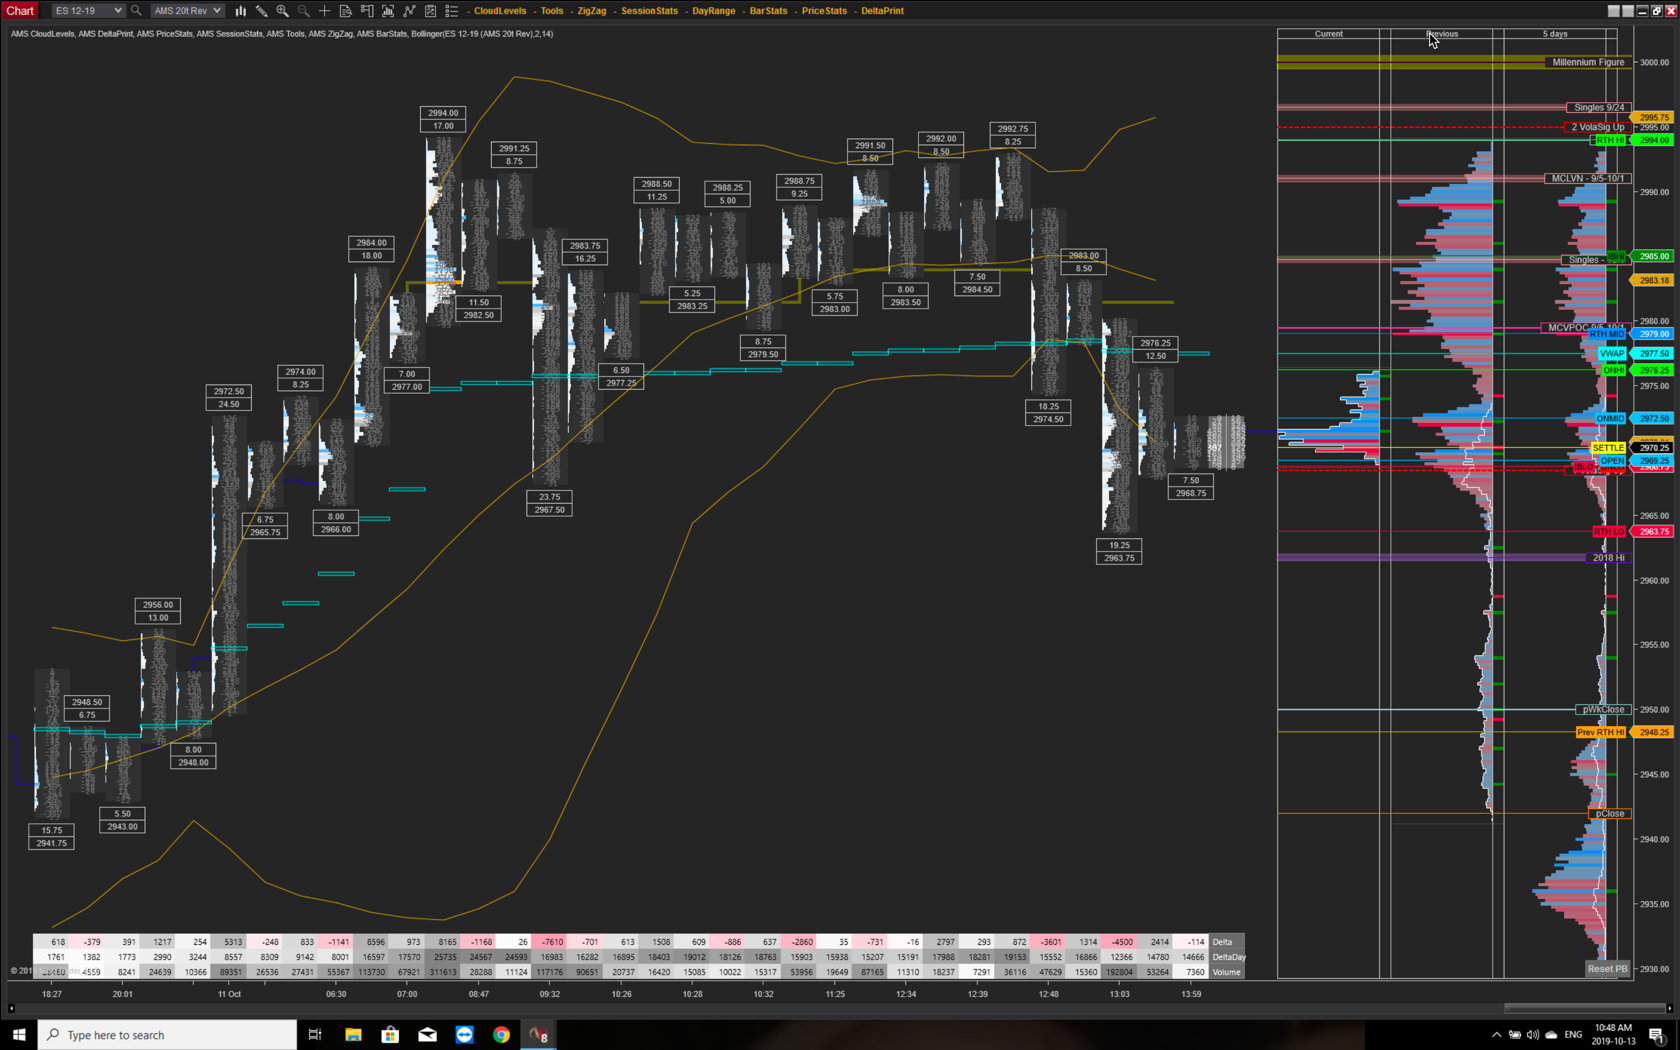
The S&P 500 futures (ESZ19:CME) made a low on Globex at 2941.75 just after 7:00 PM CT Thursday night, and made a high at 2974.00 at 6:15 am Friday morning, then opened Friday’s regular trading hours (RTH) at 2968.75, up +49.75 handles.
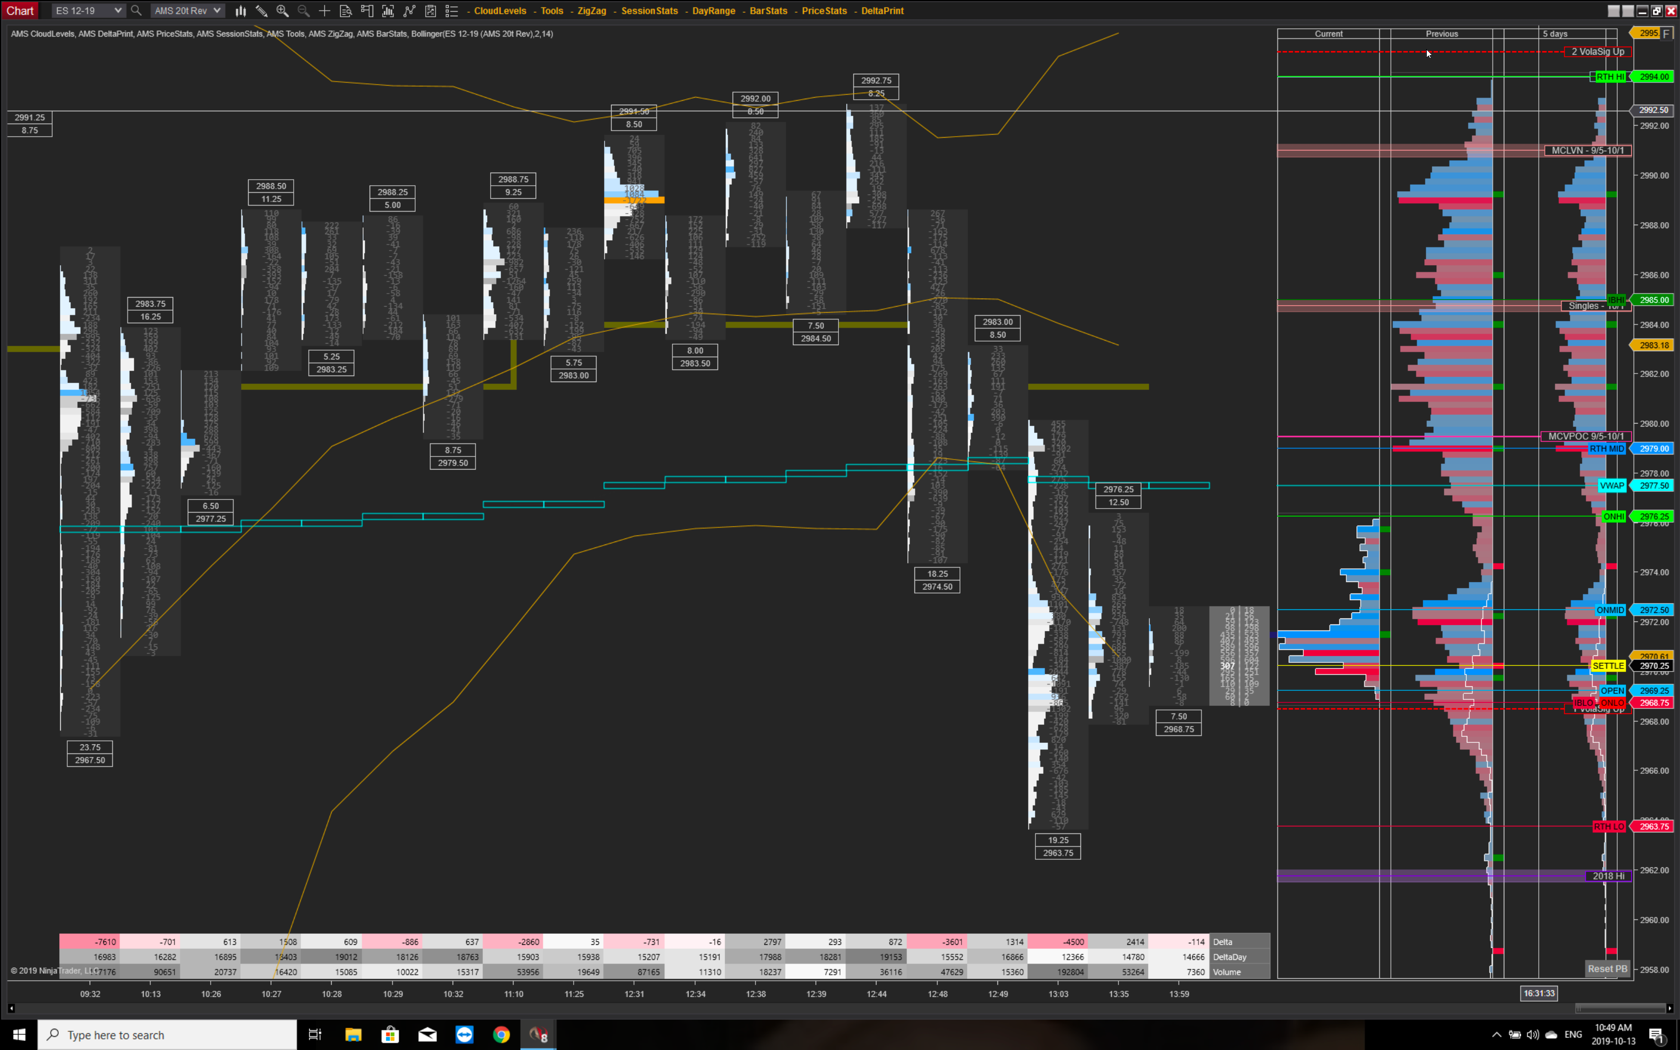
After the 8:30 CT bell, the futures traded up to 2984.00, pulled back down to 2977.00, then began to rally, trading up to traded up to 2994.00 by 10:30, up 106 handles from Wednesday nights Globex low.

DeltaPrint charts courtesy of AMS Trading Group
Not long after the high, a headline came out saying that the head Chinese negotiator had walked out on the trade meeting, and the ES sold off down to 2967.50. A few minutes after that, another headline came out saying the U.S. and China had reached a partial deal that could set up a trade truce, and the ES (ESZ19:CME) shot up to 2988.50.
From there, the futures pulled back down to the 2983.00 area, popped up to 2988.25, sold back off down to 2979.50, and then traded up to 2988.75 when another headline hit saying the partial deal could lay the groundwork for a wider deal between Trump and Xi later this year (they meet at the APEC meeting in late Nov).
China would agree to some agricultural concessions under the partial deal, while the U.S. would agree to some tariff relief, and a possible delay of the new and increased tariffs scheduled to roll out.
After the pop up to 2988.75, the ES pulled back down to 2983.00 off of a Brixit headline, then got hit by a buy program going into 1:30 CT that pushed the futures up to 2991.50.

DeltaPrint charts courtesy of AMS Trading Group
The ES then pulled back down to 2987.00 as the 2:00 MiM started to show $167 million to buy. When the MiM shot up to $1.3 billion to buy, the futures ran up to 2992.00, had two pullbacks down to 2983.50 and 2984.50, then rallied back up to 2992.75 as another headline hit the tape saying that “U.S TREASURY SEC. MNUCHIN SAYS WE WILL NOT SIGN AN AGREEMENT UNTIL IT IS ON PAPER || SAYS LIU HE HAS TO GO BACK AND DO MORE WORK IN CHINA”
Stocks didn’t like that headline at all, and the ES puked down 2963.50, a 30 handle drop in less than 10 minutes. After the selloff the ES rallied up to 2973.25, and settled at 2970.25, up +20.75 handles, or +0.70%.
In the end, yes, the S&P’s rallied sharply, but the level of headlines was almost unheard of. In terms of the markets overall tone, stocks acted rock solid until Trump went on TV. In terms of the days overall trade, total volume was 1.7 million, somewhat low for the size of the range.
