
Tron (TRX) and Binance Coin (BNB) are back at it again. Which has the most profitable trade setup?
A look at current short- and long-term trading patterns alongside an analysis of technical indicators may give us an answer.
Tron (TRX) vs. Binance Coin (BNB): Price Outlook
On Dec 17, 2018, the price of TRX began a rapid upward movement. It reached a high of $0.035 on Jan 10, 2019. A gradual decrease followed.
A horizontal support line is traced at $0.217 and while a horizontal resistance line is traced at $0.315. Together, these generate the horizontal channel outlined in the graph below:
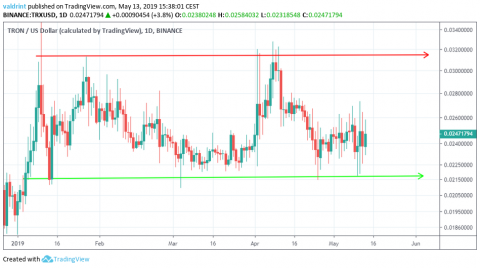
The price has touched the resistance and the support lines of the channel three and four times respectively.
The price of BNB is trading in a different pattern. After reaching a low of $6.03 on Jan 10, Binance Coin began an upward movement.
It has since been trading inside a broadening ascending wedge:
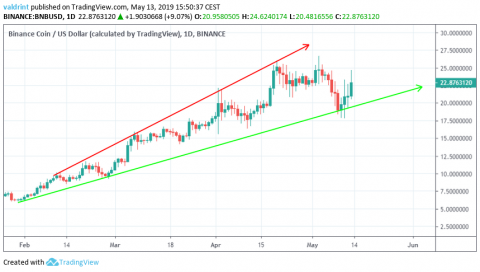
Both the resistance and support lines are upward facing. After touching the support line on May 9, the price began to increase
However, this is a bearish pattern. Thus, a breakdown for BNB appears more likely than for TRON at the current time.
To better determine price fluctuations and possible trade setups, we analyze technical indicators and shorter-term time frames in the following sections.
Tron's Short-Term Ascending Channel
In the case of TRX, the price is trading very close to the support line of the channel. Therefore, we have outlined the price alongside the RSI and the MACD below:
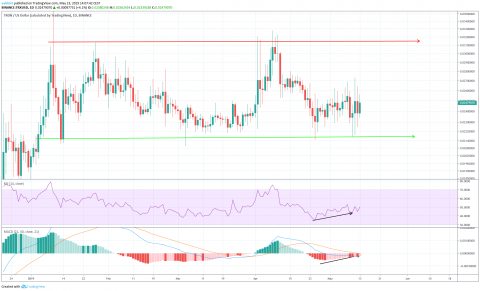
On Apr 25, the price reached a low of $0.021. After a gradual increase, it reached the same low on May 10.
Similarly, the RSI and the MACD reached lows on Apr 25. However, they have continued to generate higher values since.
This is known as bullish divergence and often precedes price increases.
The use of these indicators supports an increase towardS the resistance line of the channel.
Long Trade Setup for Tron
Therein, we stated:
"We are going to analyze a possible trade setup with an average entry of $0.023. The stop-loss is placed well below the support line and slightly below the Mar 4 wick low at $0.0207. This is a stop loss of 10%. "
Since then, the price has increased and is following the ascending support line outlined below:
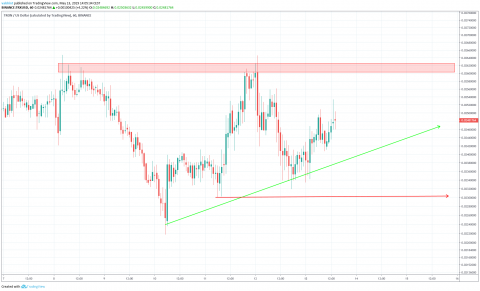
In response to current market developments, the stop loss can be moved to $0.229. This is below the support line and the May 11 lows. Taking into account last week's entry point, this stop loss will be placed at the break-even point.
Furthermore, we can see that there is a resistance area at $0.26. In our opinion, this is an optimal place to take partial profits.
Now, let's take a look at the short-term trading pattern for Binance Coin.
Binance Coin's Descending Channel
On May 10, the price of Binance Coin reached a low and a high of $18.2 and $19.8 respectively. Since then, it has been trading inside the ascending broadening wedge outlined below:
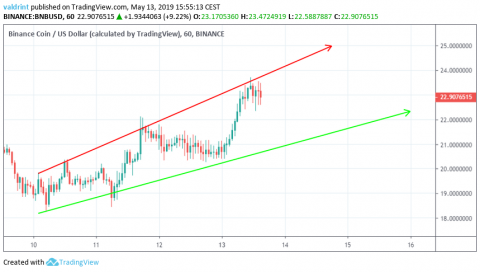
At the time of writing, the price is trading very close to the resistance line of the channel.
Will the price break out or decrease towards the support line?
To decide which is more likely, BNB price is analyzed at one-hour intervals alongside the 100- and 200-period moving averages (MAs) and the RSI below:
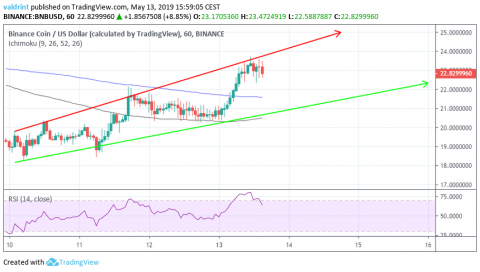
We can see that the price is trading above the 100- and 200-period moving averages. However, no bullish cross has occurred between them yet.
Furthermore, the RSI has been mirroring price movements and has not created any type of divergence.
Therefore, we do not see a profitable trade setup inside this pattern. A possible short trade setup could be identified if the price keeps increasing close to the resistance line of the wedge. Until then, however, we will not initiate a trade.
Conclusion
To conclude, TRX is trading inside a long-term neutral pattern while BNB is trading inside a bearish one. The technical indicators give a bullish outlook for TRX and a neutral one for BNB. Furthermore, we have initiated a long trade setup for TRX last week, and are currently moving the stop loss higher to a break-even point.
In the case of BNB, the price is also trading inside a short-term ascending broadening wedge. However, the indicators have not yet given a clear indication of where the price is heading.
Therefore, we believe that TRX will see more profitable price fluctuations during the upcoming weeks. While no new trade setups have been initiated for TRX, an adjustment was made in last week's setup. We are also approaching the first target in which we can take partial profits.
A summary is presented in the table below:

Disclaimer: This article is not trading advice and should not be construed as such. Always consult a trained financial professional before investing in cryptocurrencies, as the market is particularly volatile.