
Trinseo S.A. (NYSE:TSE) is slated to release third-quarter 2018 results, after the closing bell on Nov 8.
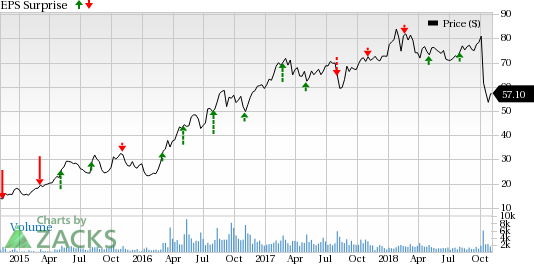
The company reported adjusted earnings per share of $2.40 for the second quarter, up 72.6% from a year ago. Earnings surpassed the Zacks Consensus Estimate of $2.18.
Trinseo reported net sales of $1,237 million, up 8% year over year.
The company surpassed the Zacks Consensus Estimate in the two of the trailing four quarters while missing twice, delivering average earnings beat of around 4%.
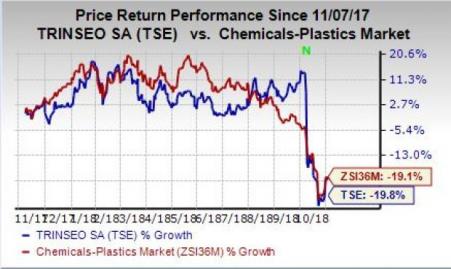
The company’s shares have lost 19.8% in a year’s time, compared with the industry’s decline of 19.1%
Let’s see how things are shaping up for this announcement.
Factors to Consider
Trinseo recently provided preliminary third-quarter 2018 results and expects net income for the quarter in the range of $74 million to $80 million, lower by $15 million from previously issued guidance of $88-$96 million. Moreover, adjusted EBITDA is expected to be between $140 million and 146 million, lower by around $12 million from previous guidance of $150-$160 million. The company envisions adjusted EPS for the quarter in the range of $1.84-$1.97.
The Zacks Consensus Estimate for third-quarter revenues for Trinseo is currently pegged at $1,157 million, reflecting a rise of 5.5% year over year.
The company stated, in its preliminary third-quarter results, that its Performance Plastics and Synthetic Rubber segments’ margins and sales volume were negatively impacted by higher raw materials costs, weaker tire market and a slowdown in the automotive industry. The company anticipates weakness in the automotive and tire markets moving ahead. Moreover, the slowdown in China and trade uncertainty will impact future results.
Additionally, the company also stated that operating results in the Latex Binders, Synthetic Rubber, and Performance Plastics for the third quarter were unfavorably impacted by lower customer demand owing to uncertainty of global trade dynamics and customer destocking.
In the second quarter, net sales at the Feedstocks segment decreased year over year on lower styrene related sales volumes. The company expects adjusted EBITDA for the Feedstocks segment to be around $20 million higher than its earlier guidance due to better-than-expected styrene margins in Europe and Asia in the latter part of the quarter.
Trinseo S.A. Price and EPS Surprise
Earnings Whispers
Our proven model does not show that Trinseo is likely to beat the Zacks Consensus Estimate this earnings season. This is because a stock needs to have both — a positive Earnings ESP and a Zacks Rank #1 (Strong Buy), 2 (Buy) or 3 (Hold) — for this to happen. This is not the case here as you will see below:
Earnings ESP: Trinseo has an Earnings ESP of 0.00%. The Zacks Consensus Estimate for third-quarter earnings is pegged at $1.80. You can uncover the best stocks to buy or sell before they’re reported with our Earnings ESP Filter.
Zacks Rank: Trinseo carries a Zacks Rank #4 (Sell). Note that stocks with a Zacks Rank #4 or 5 (Strong Sell) should never be considered going into an earnings announcement.
Stocks to Consider
Here are some companies you may want to consider as our model shows these have the right combination of elements to post an earnings beat this quarter:
Humana Inc. (NYSE:HUM) has an Earnings ESP of +2.22% and a Zacks Rank #2. You can see the complete list of today’s Zacks #1 Rank stocks here.
Flowserve Corporation (NYSE:FLS) has an Earnings ESP of +1.72% and a Zacks Rank #2.
Osisko Gold Royalties Ltd (TO:OR) has an Earnings ESP of +19.05% and a Zacks Rank #3.
Today's Stocks from Zacks' Hottest Strategies
It's hard to believe, even for us at Zacks. But while the market gained +21.9% in 2017, our top stock-picking screens have returned +115.0%, +109.3%, +104.9%, +98.6%, and +67.1%.
And this outperformance has not just been a recent phenomenon. Over the years it has been remarkably consistent. From 2000 - 2017, the composite yearly average gain for these strategies has beaten the market more than 19X over. Maybe even more remarkable is the fact that we're willing to share their latest stocks with you without cost or obligation.
See Them Free>>
Trinseo S.A. (TSE): Free Stock Analysis Report
Flowserve Corporation (FLS): Free Stock Analysis Report
Humana Inc. (HUM): Free Stock Analysis Report
Osisko Gold Royalties Ltd (OR): Free Stock Analysis Report
Original post
Zacks Investment Research