Before we carry forward, I like to mention there is always a risk going on multi pairs of the same cross. Hence, it is advisable to choose one cross on the same pair, for chances of one going wrong would indicate the other will be wrong as well.
So to limit exposure; caution is advisable. For the day we have 2 set on the same crosses.
1… AUD/USD and EUR/AUD → Prefer AUD/USD or scale down on both positions if both come in and opt to go for both
2.. USD/JPY and GBP/JPY → Prefer GBP/JPY or scale down on both positions if both come in and opt to go for both
XAU/USD
Gold likely have put in a temporary bottom to 1071 low, and we will look for any re-attempt back to the 1068-70 zone to initiate long position for a 113X play.
Gold fell 60 USD from 1131.29 down to 1071.28, breaking the 5 years low, but managed to rebound strongly. The fall, however, was brutal, with news on China and expectation of US rate selling gold. Fundamentally, gold can see more weakness, as China has been the main buyer in the past; if it decides to reduce the holding, it can prompt another round of selling that can take the pair down to mid 9XX.
However, looking from a technical point of view, we feel that gold just may have found a temporary bottom, and can possibly try to stage a rally for a 1137-40 level. We, however, would like to see another test lower to Monday’s low, and a rejection to consider going long for the intended target. Our extended target on the long resides to mid 116X.
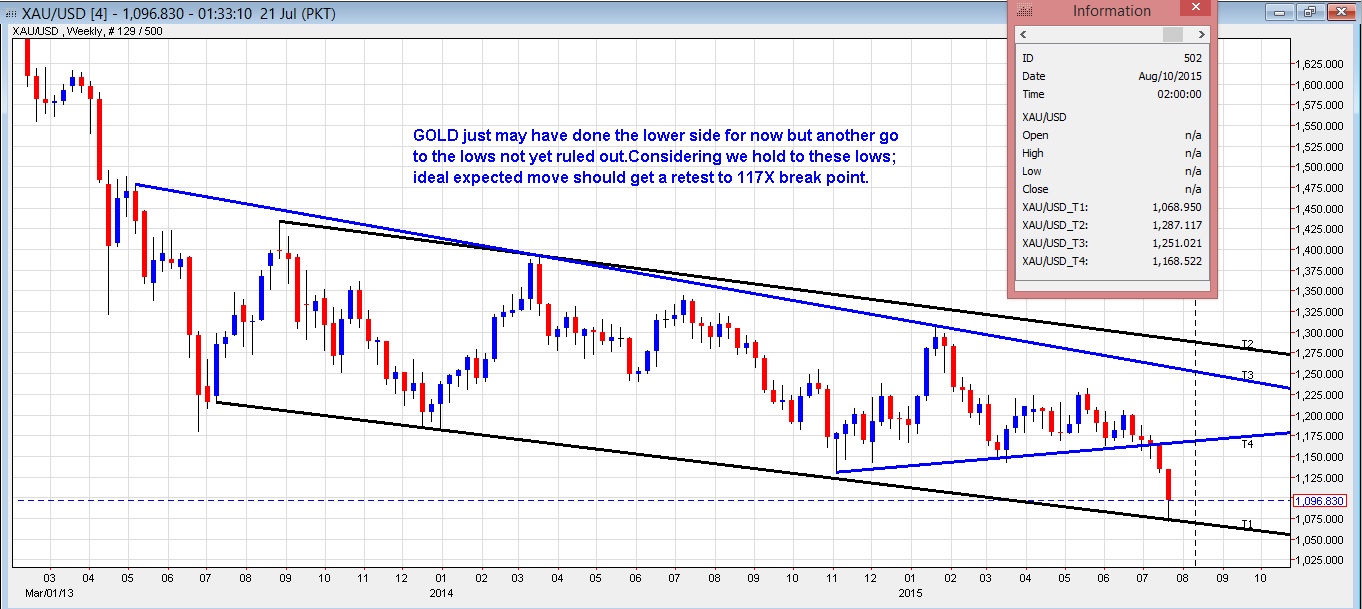
GOLD Weekly – Main Channel in Play 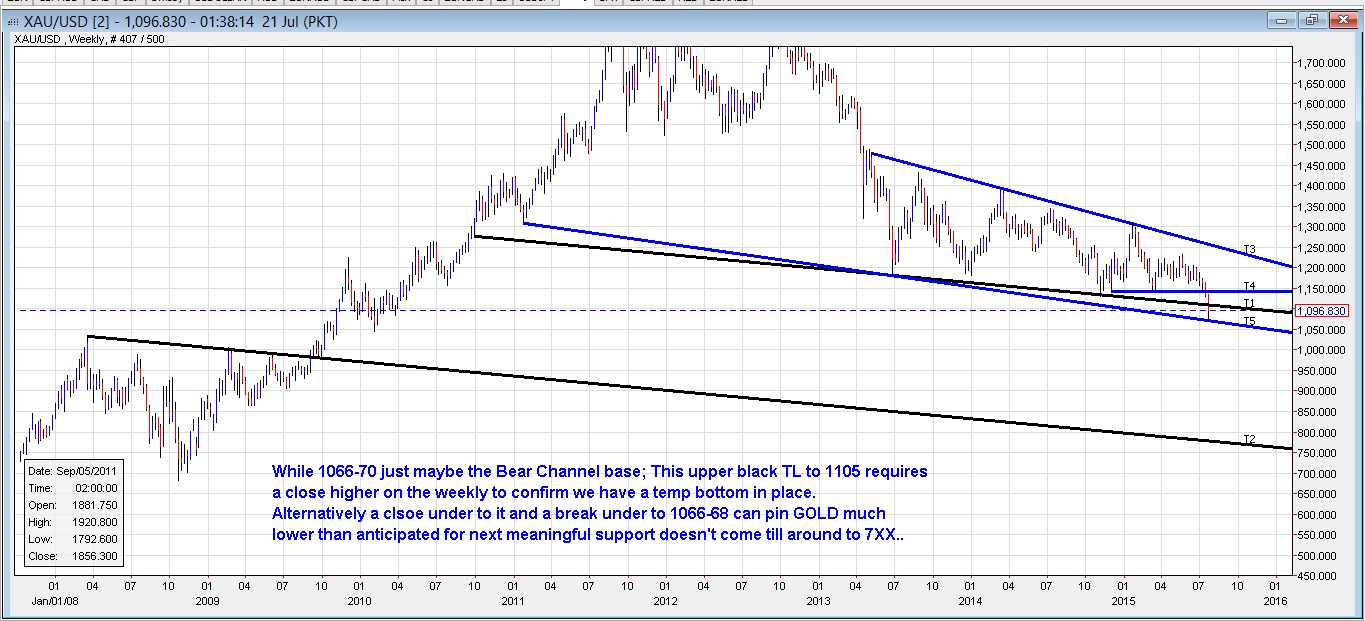
GOLD Weekly – All in chart 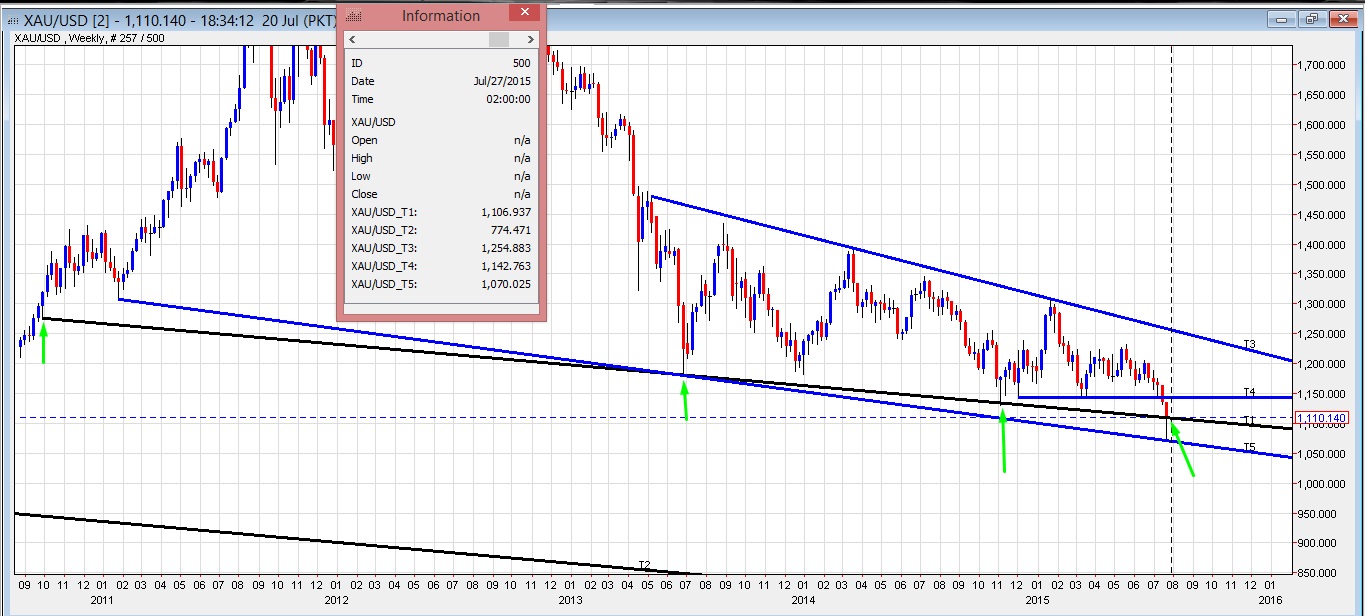
GOLD Weekly – Close Up View, and while the bear channel base has been tested, we still need to get a weekly close higher to the upper black trend line to fortify the view on the temporary bottom is in. This trend line has been in play for a considerable amount of time and, as such, still holds weight. 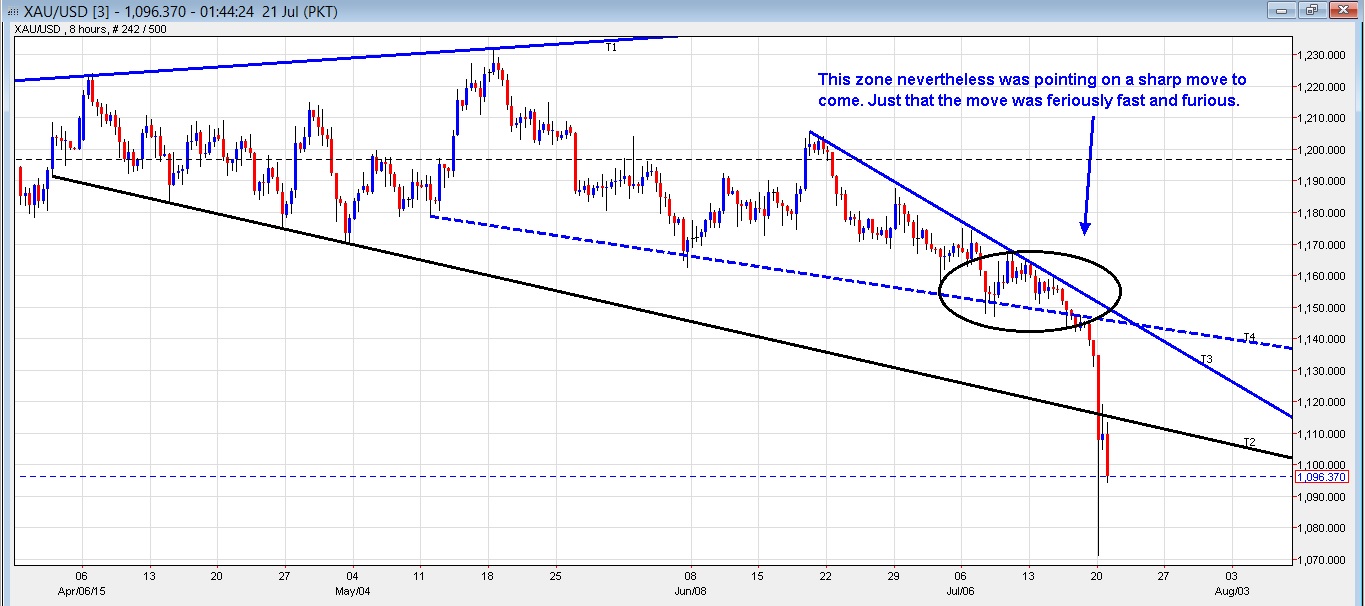
GOLD 8 hrs – Last, but not least, 8 hour channel support now is turning resistance, and we like this dip to test the lows again and meet listed conditions to initiate longs.
EUR/AUD
We are interested to see a test closer to 1.456X zone to go long on the pair, with a moderate target to 1.4750 or closer. Overall would prefer a run back to 1.486X handle if we can break and close higher to 1.4750-60 listed resistance.
Nothing much has changed from our view posted on the Monday, apart from support and resistance both declining 50 odd pips. Fundamentally speaking, AUD has more rate cuts in pipeline as initiated by RBA; EUR/AUD can provide an attractive risk to reward opportunity, considering we hold to the desire level.
To sum it up, 1.456X is decent support and if it holds, we can see a bounce higher towards 1.4750, with extended support to 1.486X.
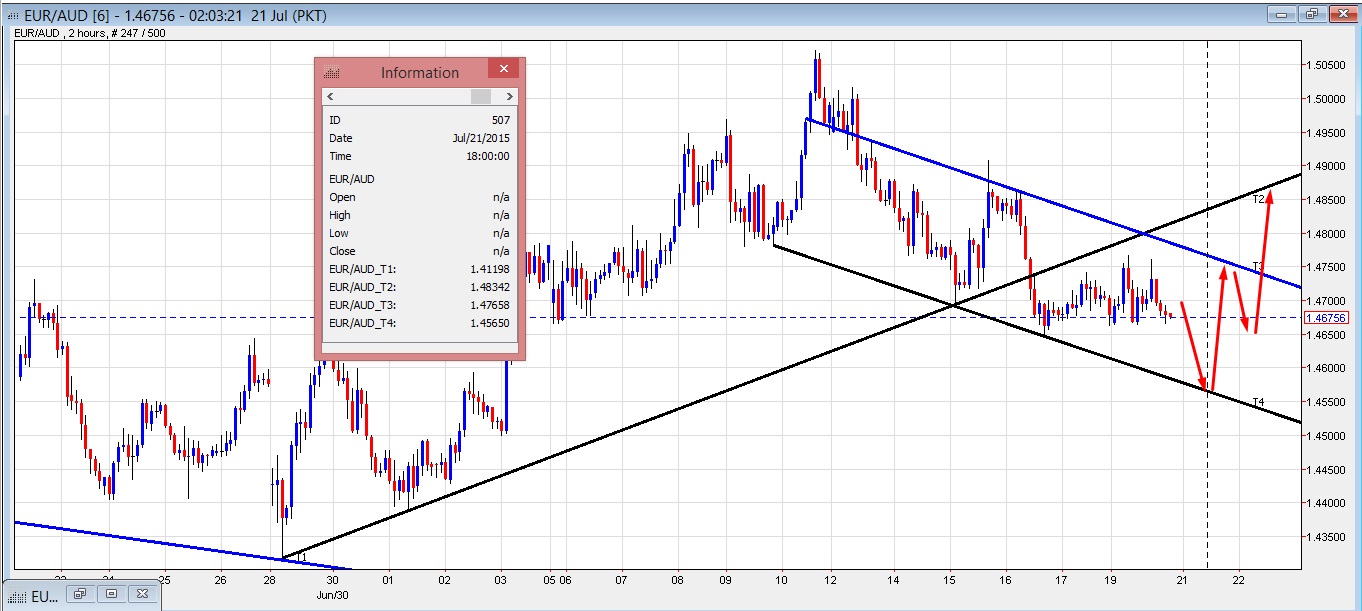 EUR/AUD 2 hrs. Intraday layout. A bounce off around 1.456X has a potential of a 300 pips rally
AUD/USD
The pair points to decent opportunities to set shorts up from 0.745X for a healthy risk to reward ratio. This level is coming up as a channel top on the main 8 hours layout and if it gets a test, we're interested to set shorts for a rundown to 0.7200 handle.
AUD/USD, as a commodity currency, has been hit hard by falling commodity and metal prices, along with slowing down in China.
Adding fuel to the fire is RBA Governor Mr. Steven sounding dovish and a possible further interest rate cut is in the pipeline; meanwhile, Fed Chairperson Yellen is reiterating and on course to hike the rates. If today’s Monetary Policy Minutes Meeting reads dovish, AUD is most likely to find itself on the defensive footing and nail to the wall.
The technical picture also agrees with the fundamentals, and it is all but a matter of time before we see next round of selling on the pair.
To sum it up, while 0.745X offers best entry to go short, aggressive players will look to sell the 7320 break for initial target of 725X. A break under 7250 can make way for the optimum run down to 7200 handle.
Alternatively, we can look to buy off 7200 support for a move back to 7250.
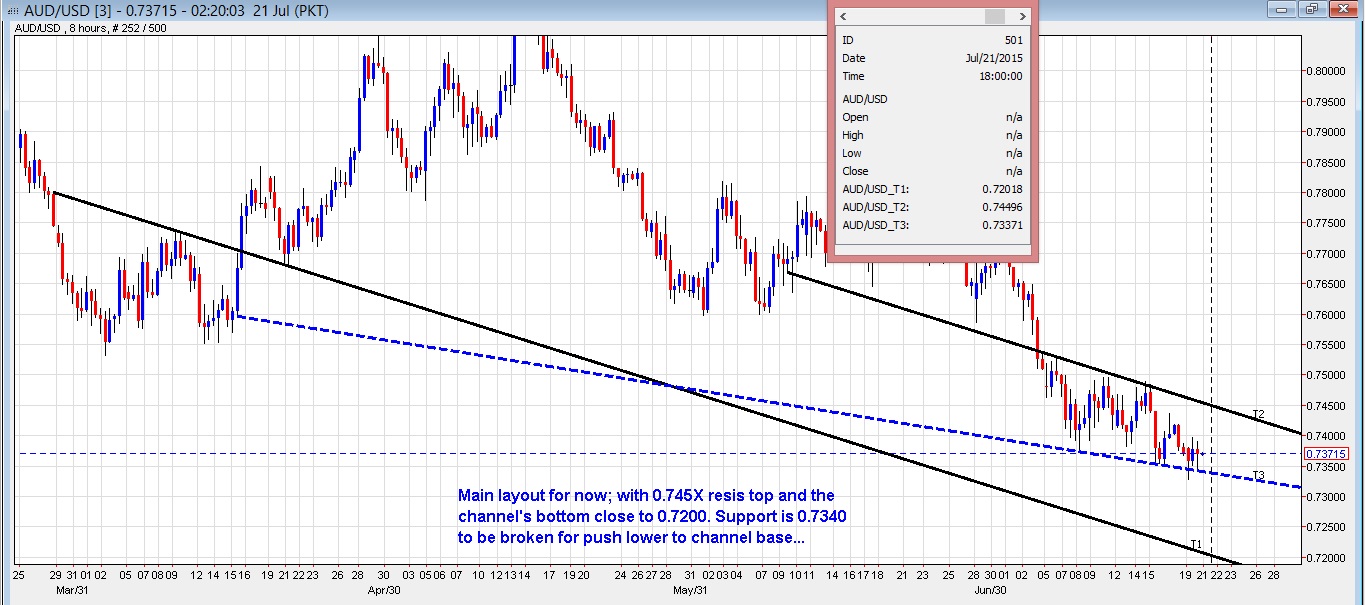
AUD/USD 8 hrs – Main layout 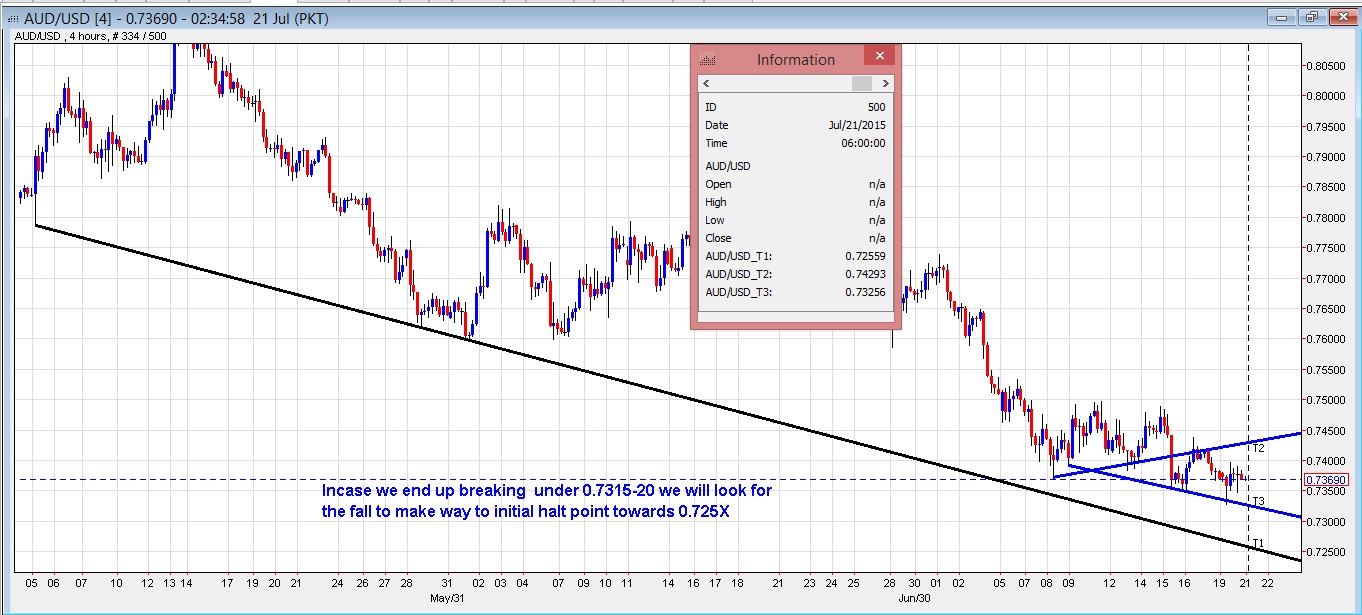
AUD/USD 4 hr – Initial support of 7245-50
USD/JPY
We are bullish on the pair, but looking for dips to get into longs. 123.40-50 comes in as a decent looking retrace to get in longs for a possible run higher towards 125.5X.
With yen interest rate at all-time low, while US is poised to hike rates, we are expecting a significant move to the higher side on the bigger picture. Technical aspect of USD/JPY pins it higher as well. Beside the pattern that suggests on long side to make its way to 125.5X with further potential grind higher towards 130 handle.
Hence, 123.4X retest and a halt suggests going long on the pair for an initial move towards late 124.7X.
Alternatively, we can look to sell from 124.7X test and a halt for a move down to 124.5X
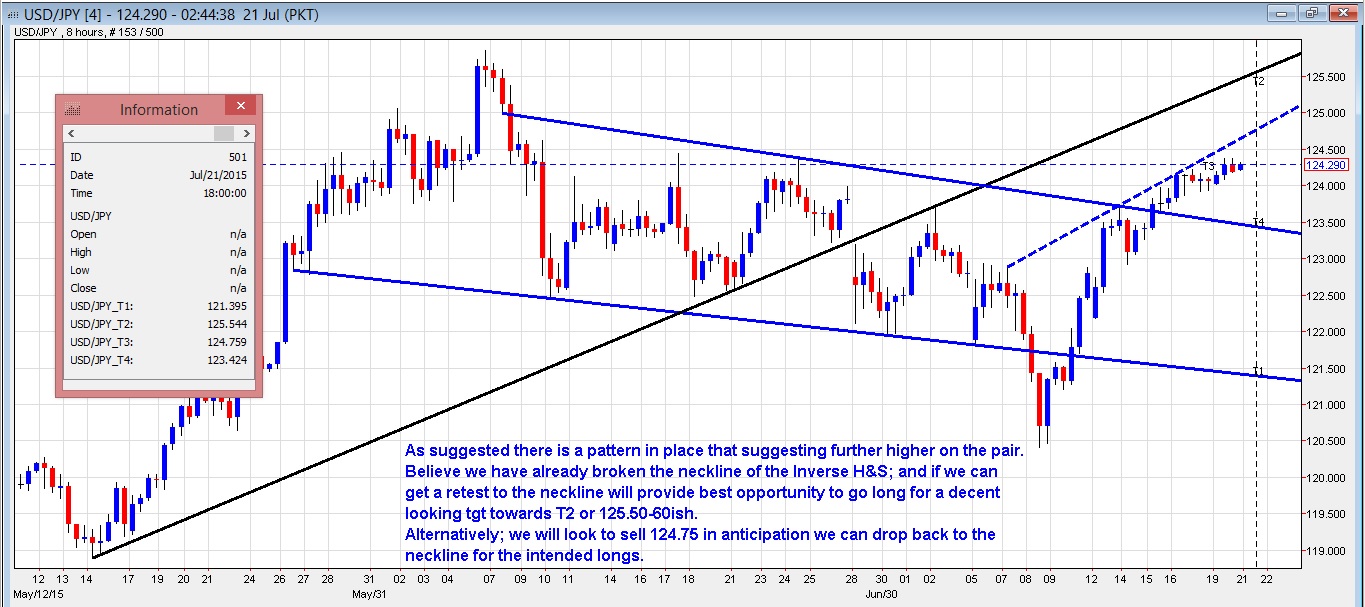
USD/JPY 8 hr-pattern 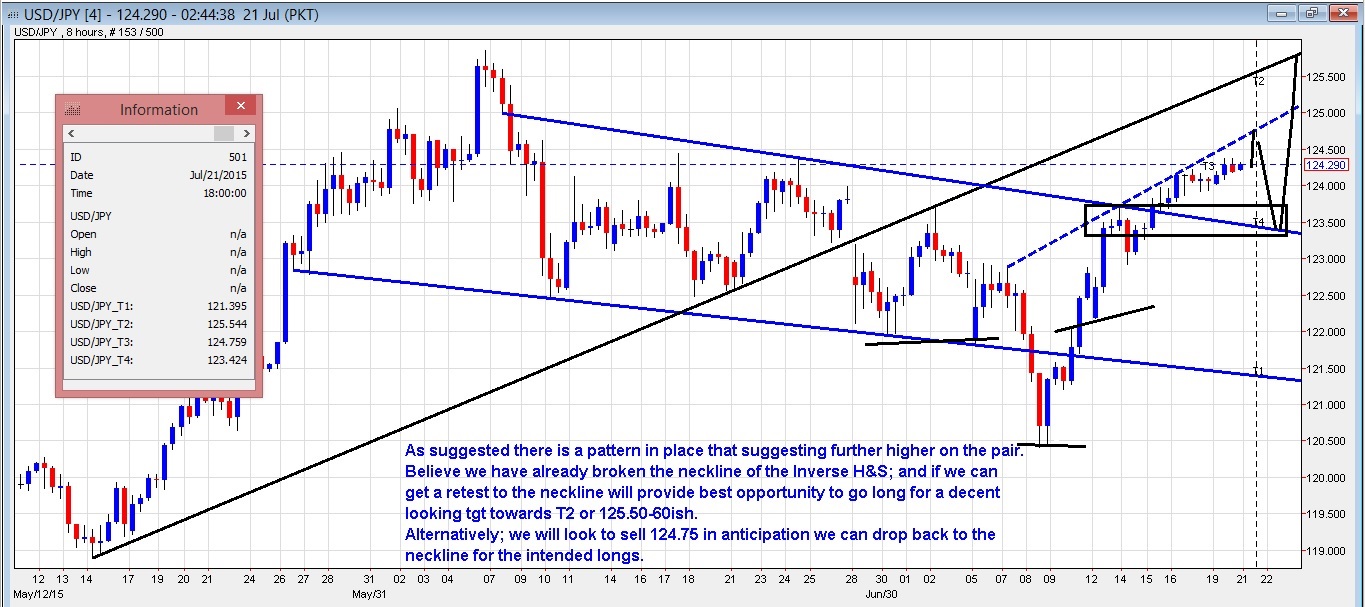
USD/JPY 8 Hour Chart
GBP/JPY
Considering a pattern in play on the pair, we are ideally looking for a test of 192.20-30 and a halt to consider going long for a possible move heading right into 196 handle.
With USD/JPY looking to hit higher notes against the USD after few pullbacks, and GBP/USD, on the other hand, showing resilience and coming in stronger against most of the crosses; this could be an ideal setup to have a small retrace on GBP/JPY for the new weekly candle and then continue with the rally higher.
Considering the swings it can perform and looking at the 4 hrs layout, a move towards 196.10-2X comes in as an ideal long position target, and once done to it, can consider shorting for a possible pull back to 191.XX.
The 196.XX target comes in as the neckline of the bigger and better Inverse Head and Shoulder it is depicting and as evident on most instances, the neckline on initial attempts usually holds out.
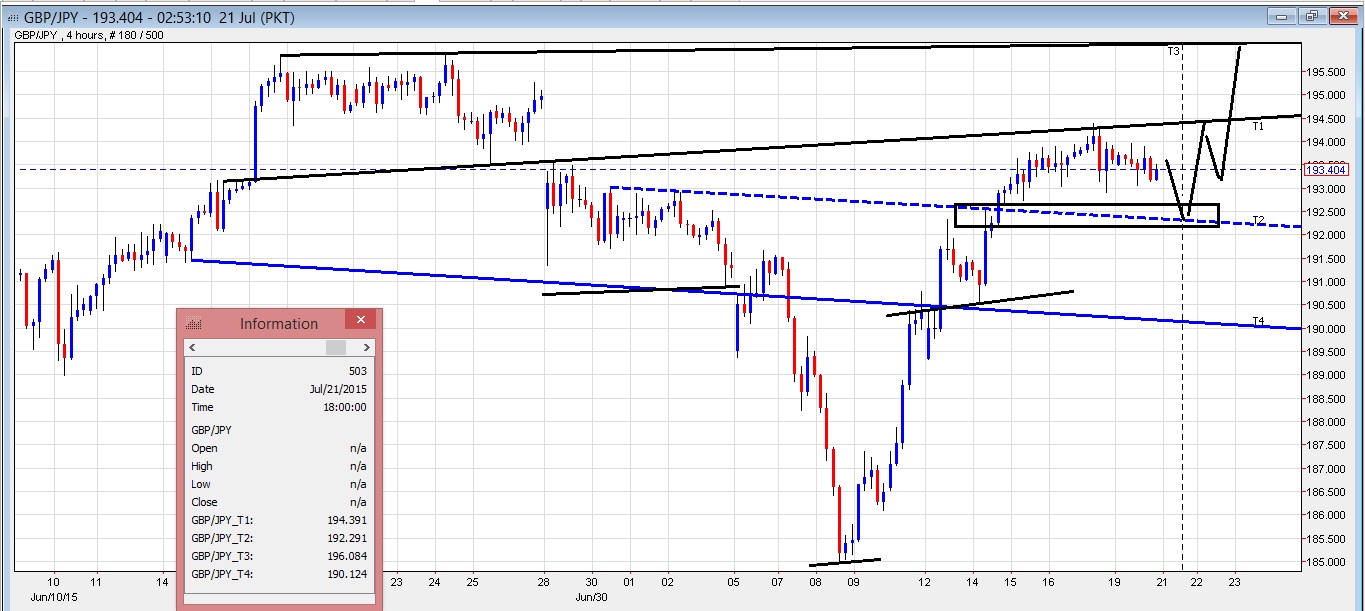
GBP/JPY 4 hrs – Inverse Head and Shoulder view with 196 target
