First day of trading after the NFP release saw major USD pairs staging rallies and breaking their NFP held highs.
USD/CAD in particular was the front runner on the assault on the US dollar with EUR and GBP following the lead respectively. USDJPY however failed to gain momentum and was hit hard on its crosses; particularly against the CAD and the GBP.
Technically we can see more fallout on the US dollar and expect the majors to carry on to the march higher for now possibly providing better shorting opportunities in days to come.
EUR/JPY
We like to see a test to the top of the range on Daily and the 8-hour coming roughly to 138.3X to enter shorts for a possible move towards 137.10 with potential run lower to mid 135.XX.
While most of the pairs rallied against the US dollar strongly, breaking their respective NFP highs; USD/JPY stalled within a tight range and it’s crosses took the brunt from all direction.
Euro seems bullish on the break above NFP’s high and next important resistance is seen to 1.109X handle. If euro continues the march to the mention resistance; it is likely we see EUR/JPY making it to 138.3X zone to set shorts up.
If aggressive can use the 2-hour layout with support to 136.8X to consider going long upon it’s test and a hold.
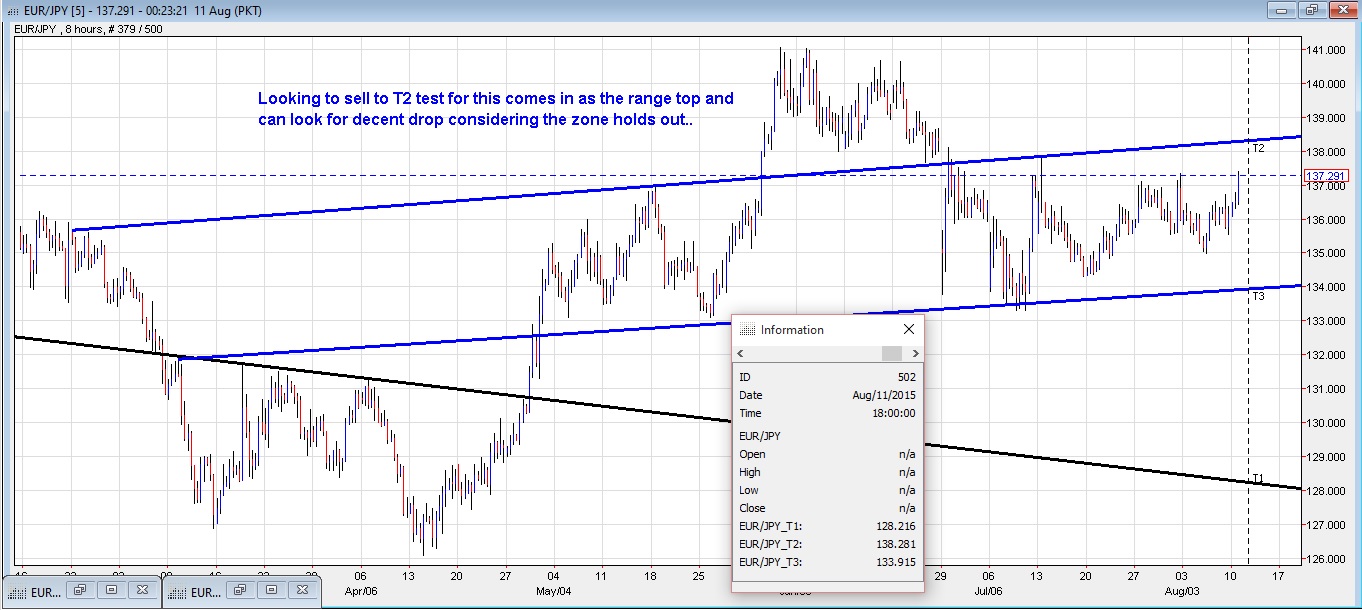
Approaching possible range top to set shorts up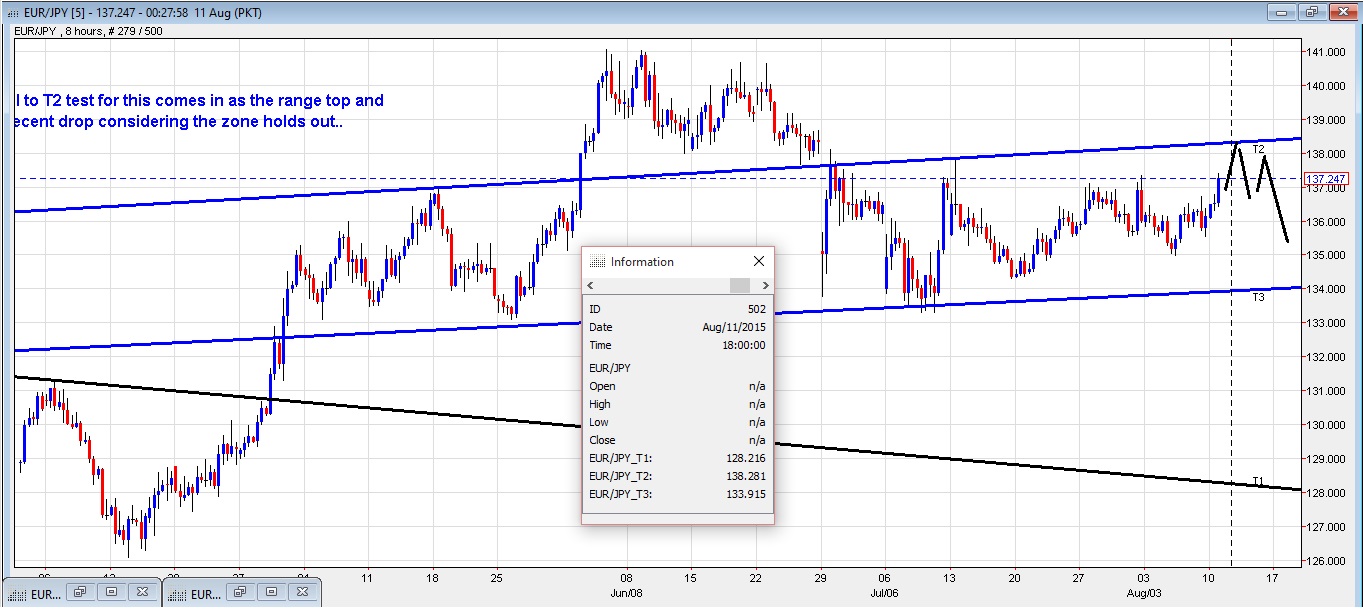 Approaching possible range top to set shorts up – Close up.
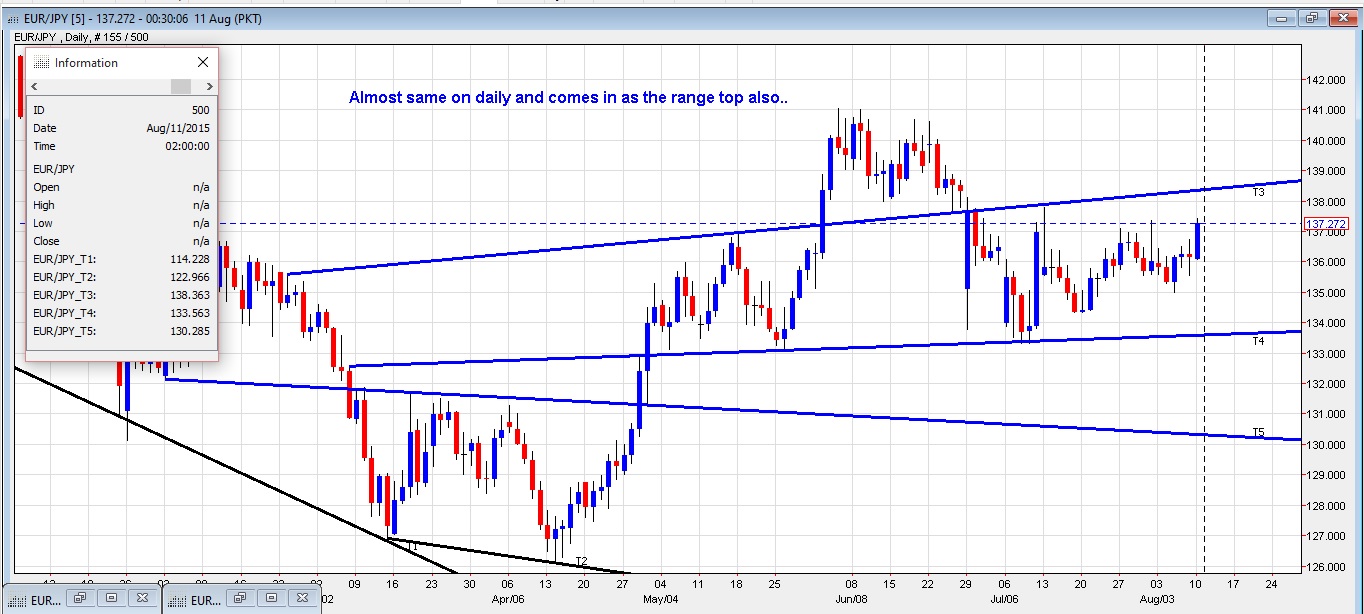 Identical to the 8-hour view.
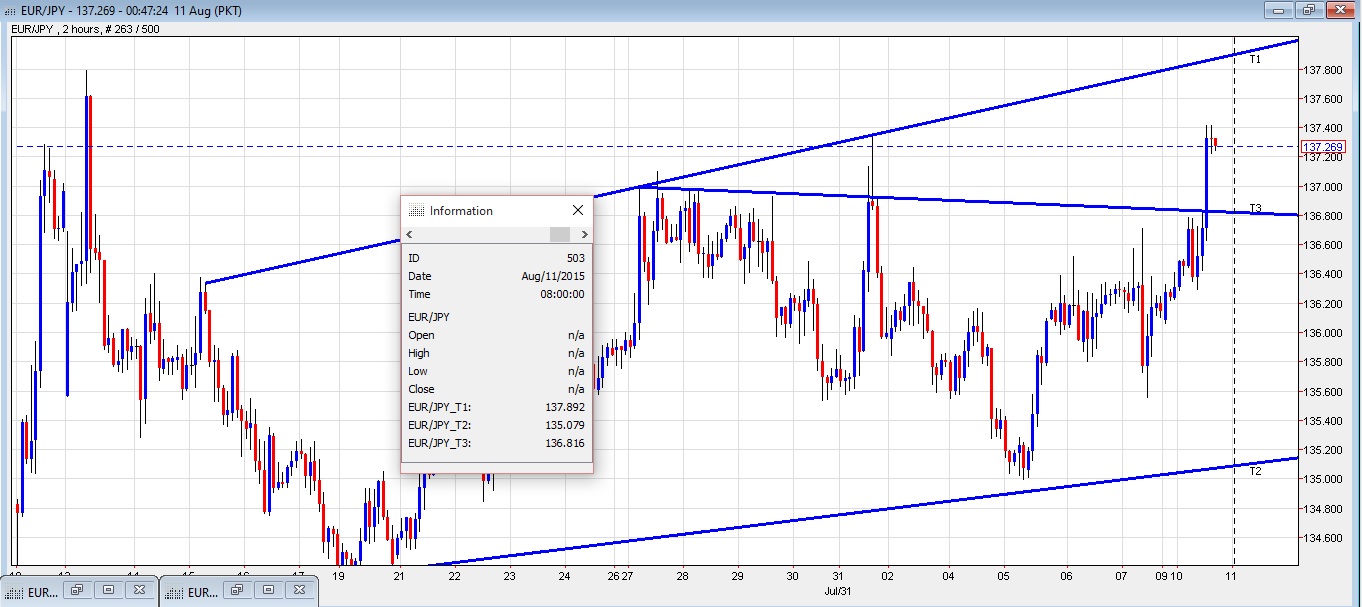 136.8X test & hold; comes in as decent support to try longs.
AUD/USD
We carry the same view from yesterday and looking at 746X as a possible range top and a decent resistance which if gets a test and a hold like to set shorts on it.
The only added information from yesterday’s posting on the pair is the NAB Business Confidence release coming out in early Asia and we can see some decent flows on the pair. With that in mind; we like to see a test and a hold to the interested zone to set shorts up on the pair.
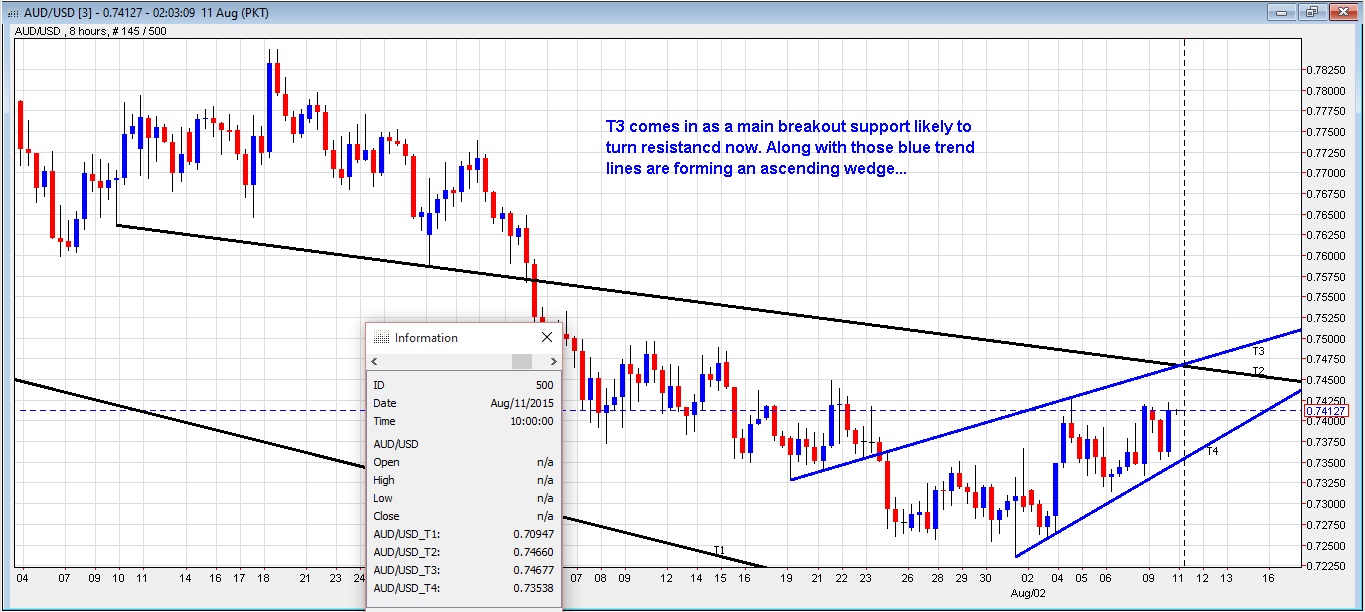 T2 & T3 forming dual resistance; test and a hold to set shorts.
USD/CAD
The pair traded heavily on Monday and we believe there is more to be seen on the lower side preferably to around 2910 zone and like to initiate buys off here for it seems like a decent drop zone to end the correction.
USD/CAD traded heavily today; with break under 3070 saw the pair making a fast run to 2991 test. Rising oil price was possibly one of the factor along with stops been triggered that explains the rally on the pair.
With nothing much on news for today; 307X is resistance and if aggressive can short from there with main target to 2910 zone. Alternatively this later level comes in as a decent spot which can signal an end to the correction and march back higher.
Hence; we like to try longs if price gets a test to 2905-10 for a possible move back to 307X with potential run higher for newer yearly highs.
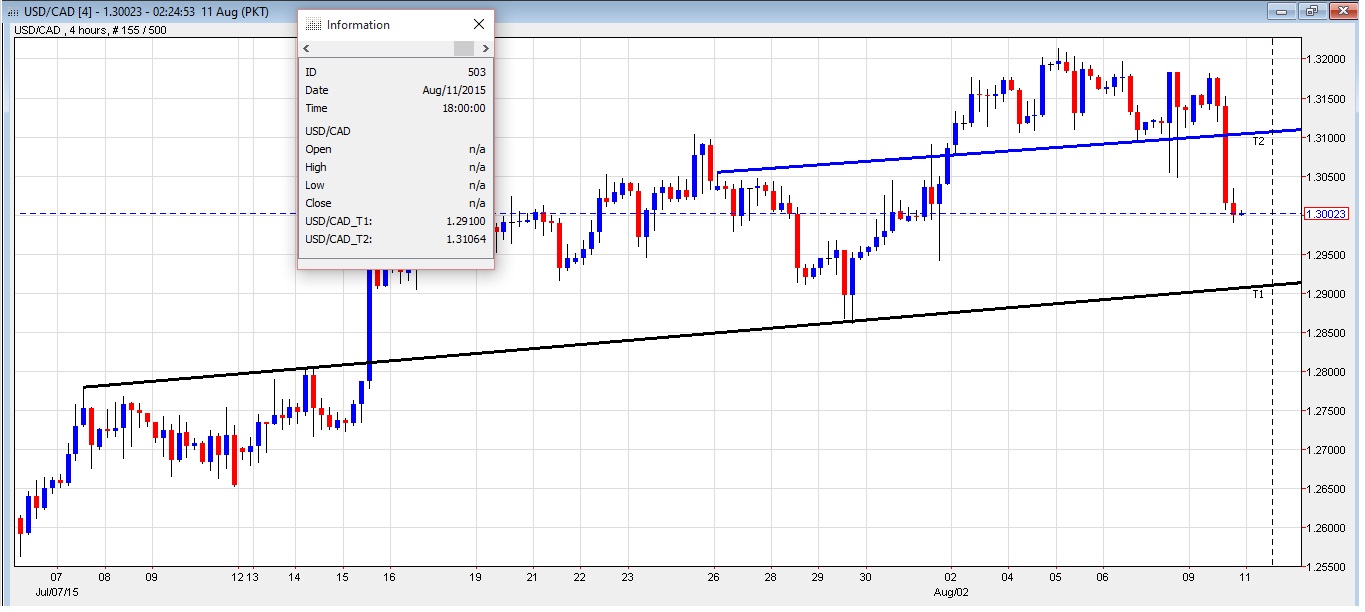 2905-10 important support that can see correction ending to it.
