Our base case has been that all of the central bank and government stimulus would not prevent pervasive global demand destruction as the virus continued to spread...that the stimulus inspired “risk on” trade in financial markets would “roll over” once the divergence between the real economy and the financial markets got too wide.
However...as traders we understand that “over-valuation” is not a catalyst for change or a timing tool. We understand that the only thing we can trade is price...so we’ve been watching price action across markets...looking for indications that the time has come to begin fading the “risk on” rally. Over the past few weeks we have written about Island tops, irrational exuberance, key turn dates, changes in market psychology and other “signs” that the “risk on” rally was getting tired.
At present we are cautiously positioned to benefit from a drop in WTI, the S&P 500 and commodity currencies. We will be looking for opportunities to add to those positions and/or to take other positions that would benefit from market psychology turning to “risk off.”
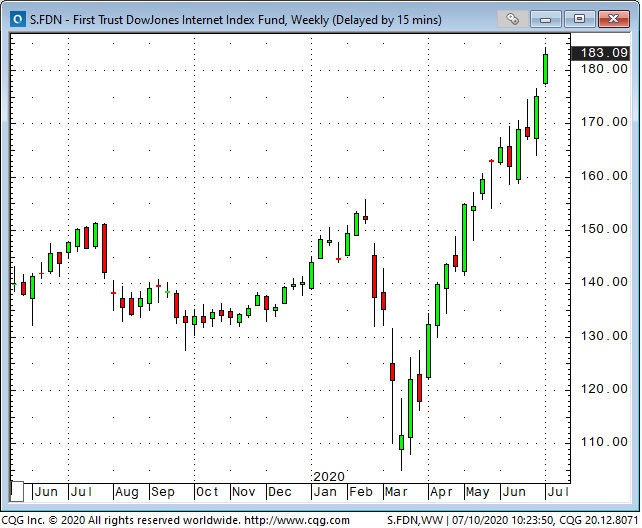
The U.S. “stock market” is absolutely not monolithic. Share prices of some companies have sky-rocketed since the March lows while many others have struggled. We limit our trading to futures and options contracts so we only trade stock indices...not individual shares...but we certainly watch the price action of many listed companies and ETFs for clues about market psychology. FDN holds a basket of leading Internet names and has had a spectacular rise from the March lows as Internet sales have soared while brick-and-mortar retail sales have faltered.
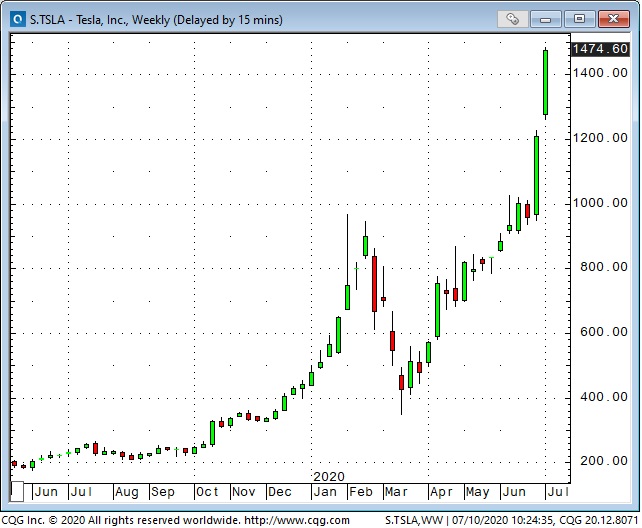
Tesla's (NASDAQ:TSLA) market cap (~$260B) is larger than that of any other auto company...is greater than the market cap of many other major auto companies combined. This may be a classic example of Irrational Exuberance around market highs.
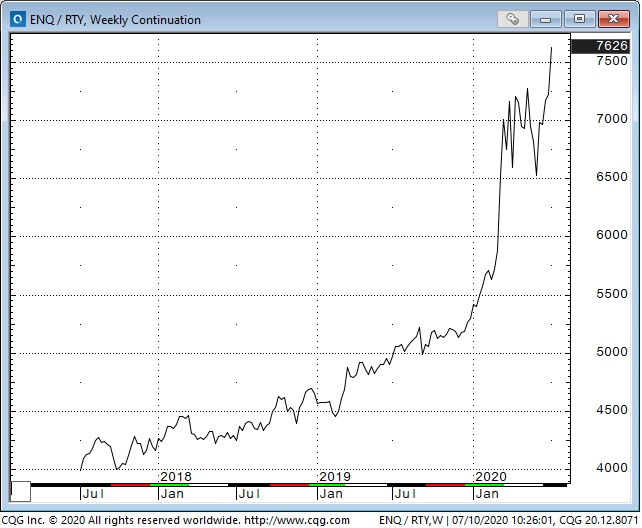
The ratio between the Nasdaq 100 and the Russell 2000 tells the story of tech out-performance.
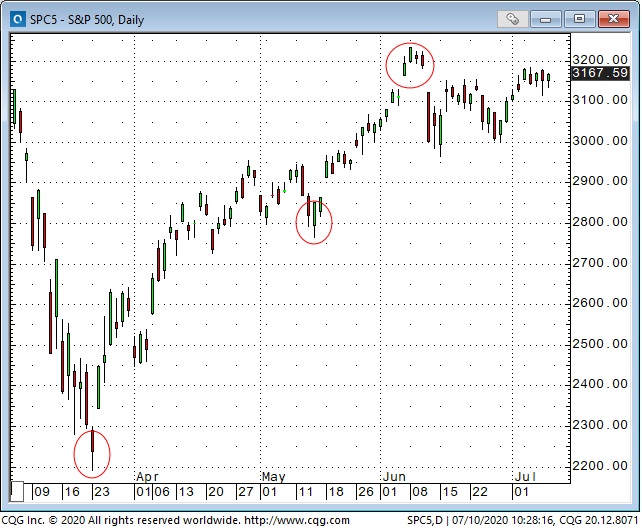
The benchmark S&P 500 Index looks more like the Russell 2000 than the Nasdaq 100. We’ve written about the key turn dates and Island reversals in the S&P...last month we were thinking that the rally off the March lows was showing signs of “rolling over” but we acknowledge that the BTD bid has been strong the past couple of weeks. A rally above the June highs would cancel our s/t bearish views while a break below the June lows would harden our bearish views.
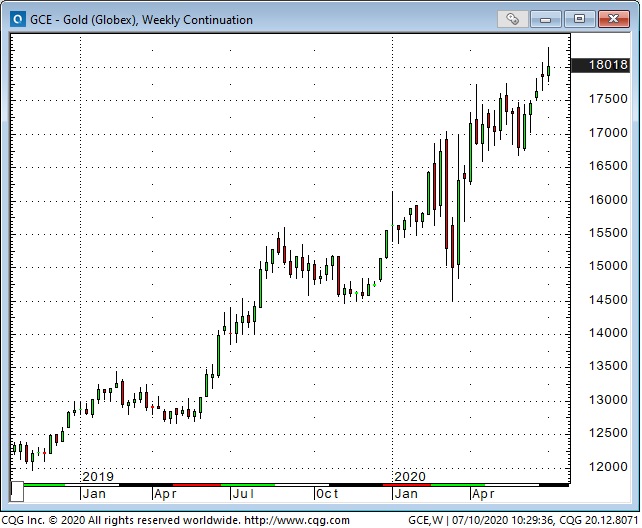
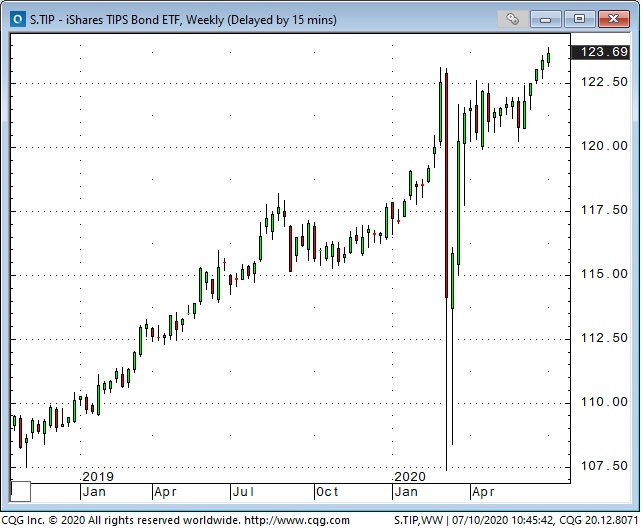
Gold traded to a 9 year high this week...up more than $500 from last year’s lows and only ~$100 away from the 2011 All-Time Highs at ~$1920. There has been record buying (~$40B) of global gold ETFs so far in 2020 and total global gold ETF holdings are at record highs. Gold has been highly correlated with falling real yields (rising prices on the TIPS chart mean lower real yields.Real yields, that is nominal rates minus inflation, on 10-year US Treasuries are currently negative.)
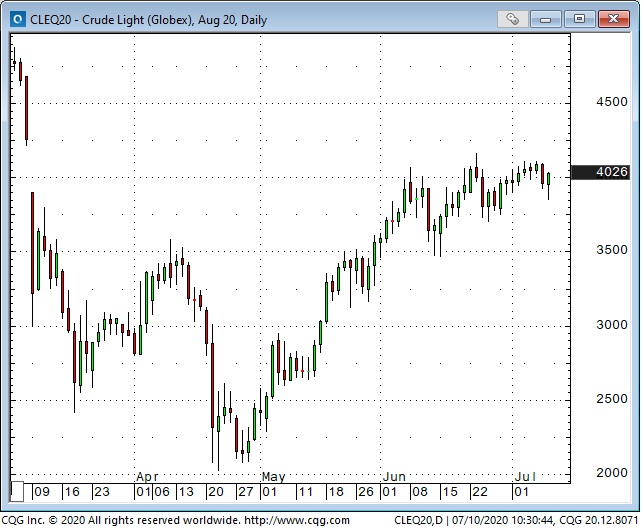
The May WTI futures contract traded to around negative $40 when it expired on April 20th but the August contract only traded to a low of around ~$20 at that time and has since rallied to ~$40 as “risk on” market psychology showed up in the crude market. During this “risk on” period WTI contangoes have flattened dramatically as fears of the market running out of storage capacity have diminished. We are buying deferred WTI against the sale of nearby WTI looking for the contangoes to steepen as WTI turns “risk off.”
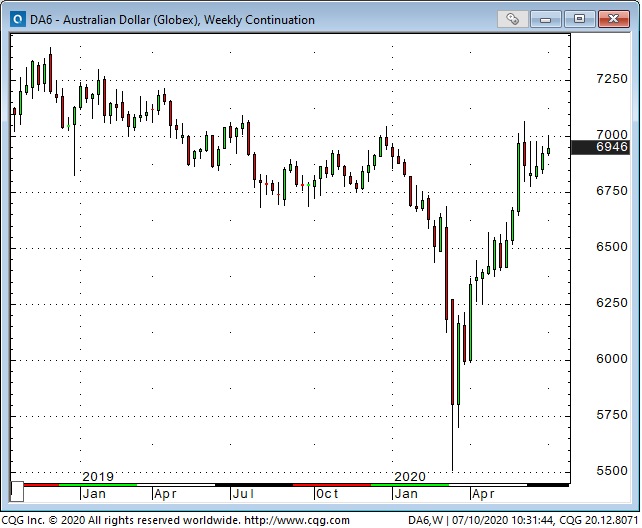
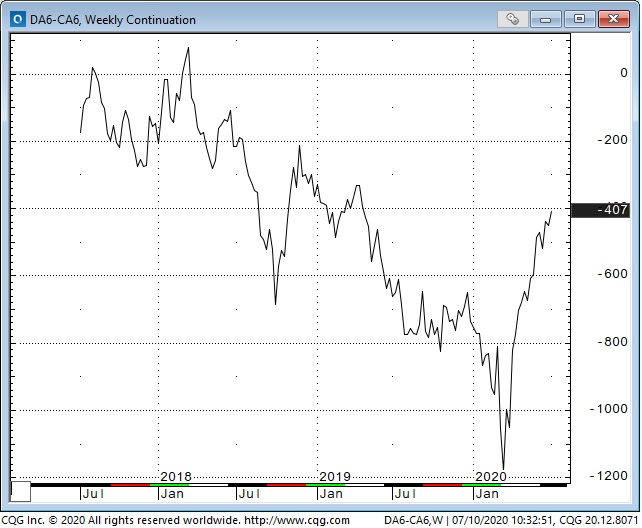
The Australian dollar had been trending lower against the USD since early 2018...got clobbered in Q1 2020...and has rallied back ~30% from its March lows as “risk on” market psychology showed up in the currency markets. In keeping with our view that “risk on” may be turning towards “risk off” we are modestly short AUD/USD. Another way of executing this idea would be to short AUD against CAD. AUD dropped nearly 20% Vs. CAD from March 2018 to March 2020 and has rebounded ~15% since then.
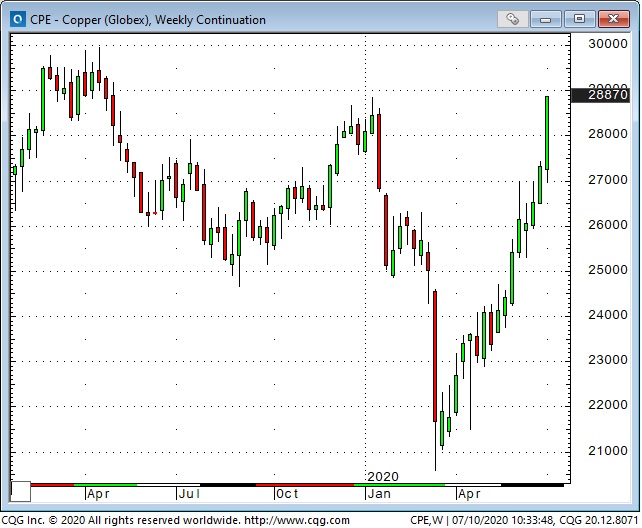
Copper has had an amazing rally off its March lows...closing higher for the last 8 consecutive weeks to trade at its best levels in over a year. The strength of the copper rally (you’ve surely heard that copper has a PhD. in economics) presents a strong challenge to our view that the “risk on” rally is running out of steam!
We believe that net trading success over time results from good risk management...not from having a great crystal ball. A trade idea may yield good profits...but if a trade’s not working cut your losses short.
