The U.S. dollar was seen trading mixed as investors gear up for the Fed meeting today. On Tuesday, economic data from the U.S. showed that the U.S. producer price index advanced 3.1% on the year in November. This was the biggest gain since January 2012. The price increase at factory gate stoked expectations that the consumer price index could come out stronger.
The November CPI data will be released today with forecasts showing a 0.4% increase on the month. The Fed's rate hike decision is also coming up. Expectation for a 25 basis points rate hike is almost certain. The Fed's projections for the year ahead and forward guidance will be key.
In the UK, the inflation data for November released yesterday showed that CPI accelerated 3.1% on the month. However, core CPI was steady, rising 2.7%.
The UK's monthly jobs data will be coming out today with forecasts showing a modest increase in wages to 2.5%.
EUR/USD intra-day analysis

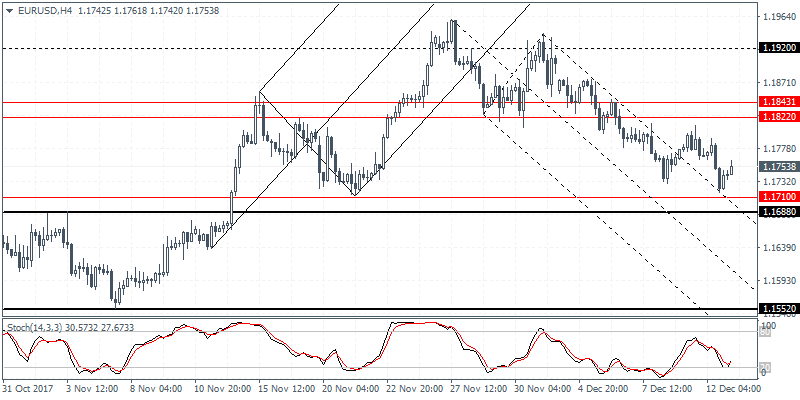
EUR/USD (1.1753): The euro posted declines yesterday as the currency pair remains trading above the 1.1700 level of support. In the short term, we could expect to see a brief retest of this support level. On the 4-hour chart, price action posted a lower low but was seen finding support off the outer median line. A short term correction towards 1.1822 - 1.1843 is quite likely where resistance could be formed. The EUR/USD could be seen maintaining the range within the resistance level mentioned and the support region near 1.1710 - 1.1700 level. A breakout below this support could potentially push EUR/USD lower. This could see price action testing the November lows near 1.1552 support.
USD/JPY intra-day analysis

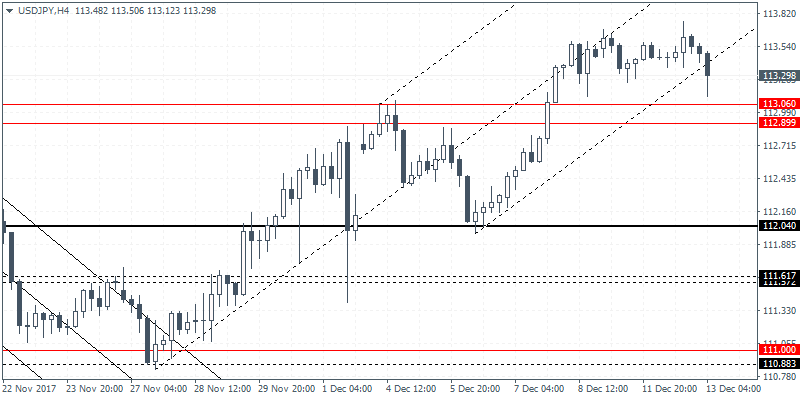
USD/JPY (113.29): The US/DJPY formed another doji pattern on the daily chart yesterday. A bearish close below the doji's low today could potentially signal further downside in price. USD/JPY is seen trading just below the previously established resistance level of 114.31 - 114.07 region. To the downside, price is pending retest of the support level near 110.70. On the 4-hour chart, the immediate support near 113.06 - 112.90 remains in focus. A break down below this support could potentially turn USDJ/PY's bias to the downside as price will then likely slide towards the 112.05 level of support. To the upside, the gains could be limited towards the previously established resistance level.
NZD/USD intra-day analysis

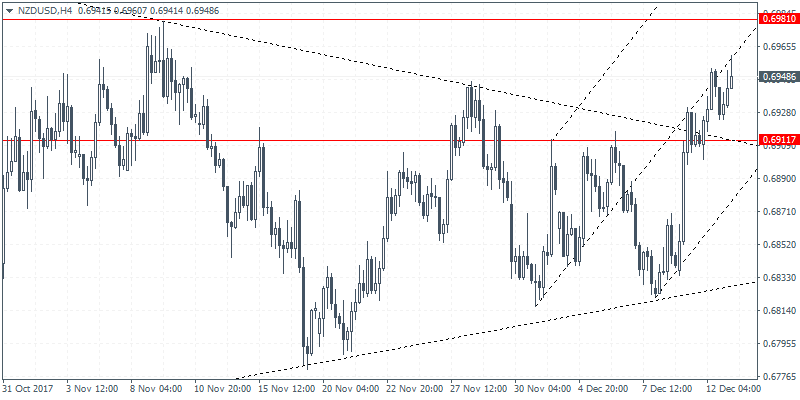
NZD/USD (0.6948): The New Zealand dollar extended gains for three consecutive days. Price action managed to remain supported above the short term price level of 0.6911. Resistance is seen at 0.6981 which could be the near term upside target in price. The breakout to the upside from the triangle consolidation pattern potentially suggests further scope for gains in NZD/USD. This will however change in the event that the kiwi slips back below the 0.6911 level. We expect to see support being formed near this level ahead of further gains towards 0.6981.
