published today (Friday) shows an increased goods and services deficit for the U.S. and Canada, as shown on the graphs below.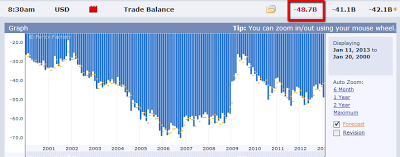
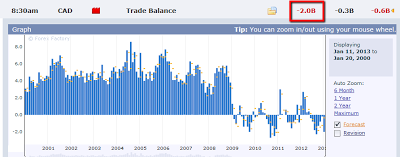
It remains to be seen how these countries will grow their exports for 2013. Export demand and currency demand are important since "foreigners must buy the domestic currency to pay for the nation's exports...and export demand also impacts production and prices at domestic manufacturers."
The U.S. $ remains in a trading range, as shown on the Weekly chart below, in between the 50 (red) and 200 (pink) smas. At the time of writing this during market hours today, volumes have increased this week on the current bearish candle -- perhaps signalling/forecasting a further weakening of the dollar in order to stimulate demand for U.S. goods and services. 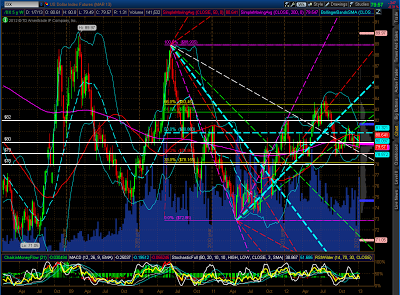
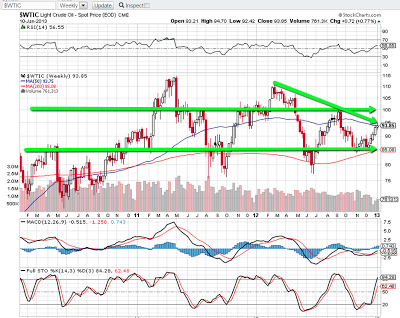
The USD/CAD forex pair remains in a large triangle formation, as shown on the Weekly chart below. At the moment, the U.S. $ is weaker and remains below parity. Rising prices on Oil and Lumber should continue to push the Canadian $ higher against the U.S. $ -- ultimately, favouring U.S. equities, and raising the cost of new homes, until the demand for them slows. 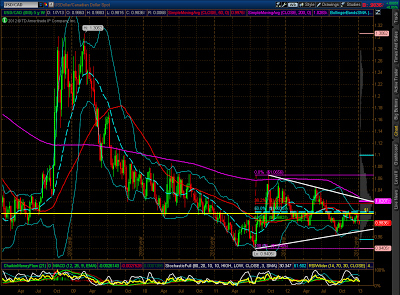
At the moment, Lumber is at 3-year highs (but the RSI, MACD, and Stochastics indicators are in overbought territory), and Oil is at resistance (the next major resistance level is 100), as shown on the Weekly charts below. 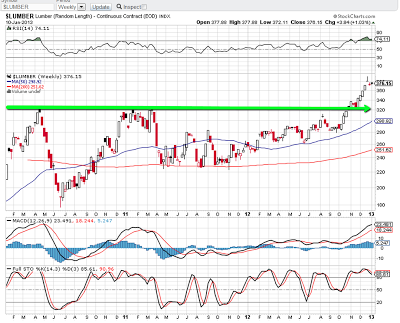
The Weekly chart below of the Homebuilders ETF (XHB) shows a desire of this market to break out to new 5-year highs, but price is at the top of a tightly-rising channel. The next major resistance level is around 30.00 -- one to watch for further direction, as any serious pullback in this ETF (and, possibly in Lumber and Oil) may negatively impact the equity market, in general. 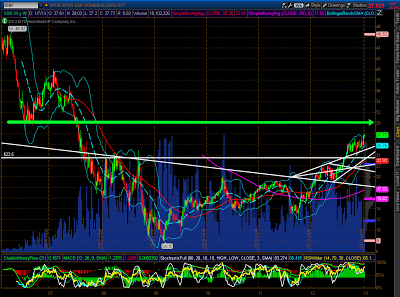
- English (UK)
- English (India)
- English (Canada)
- English (Australia)
- English (South Africa)
- English (Philippines)
- English (Nigeria)
- Deutsch
- Español (España)
- Español (México)
- Français
- Italiano
- Nederlands
- Português (Portugal)
- Polski
- Português (Brasil)
- Русский
- Türkçe
- العربية
- Ελληνικά
- Svenska
- Suomi
- עברית
- 日本語
- 한국어
- 简体中文
- 繁體中文
- Bahasa Indonesia
- Bahasa Melayu
- ไทย
- Tiếng Việt
- हिंदी
Trade Balance Deficit Widens For U.S. And Canada
Published 01/11/2013, 05:27 PM
Updated 07/09/2023, 06:31 AM
Trade Balance Deficit Widens For U.S. And Canada
Trade Balance data
Latest comments
Loading next article…
Install Our App
Risk Disclosure: Trading in financial instruments and/or cryptocurrencies involves high risks including the risk of losing some, or all, of your investment amount, and may not be suitable for all investors. Prices of cryptocurrencies are extremely volatile and may be affected by external factors such as financial, regulatory or political events. Trading on margin increases the financial risks.
Before deciding to trade in financial instrument or cryptocurrencies you should be fully informed of the risks and costs associated with trading the financial markets, carefully consider your investment objectives, level of experience, and risk appetite, and seek professional advice where needed.
Fusion Media would like to remind you that the data contained in this website is not necessarily real-time nor accurate. The data and prices on the website are not necessarily provided by any market or exchange, but may be provided by market makers, and so prices may not be accurate and may differ from the actual price at any given market, meaning prices are indicative and not appropriate for trading purposes. Fusion Media and any provider of the data contained in this website will not accept liability for any loss or damage as a result of your trading, or your reliance on the information contained within this website.
It is prohibited to use, store, reproduce, display, modify, transmit or distribute the data contained in this website without the explicit prior written permission of Fusion Media and/or the data provider. All intellectual property rights are reserved by the providers and/or the exchange providing the data contained in this website.
Fusion Media may be compensated by the advertisers that appear on the website, based on your interaction with the advertisements or advertisers.
© 2007-2024 - Fusion Media Limited. All Rights Reserved.
