
Toyota Motor Corporation (NYSE:TM) recorded earnings of ¥128.54 per share ($2.51 per ADR) in second-quarter (ended Sep 30, 2016) fiscal 2017, down from ¥192.51 per share ($3.16 per ADR) earned in second-quarter (ended Sep 30, 2015) fiscal 2016.
Earnings per ADR surpassed the Zacks Consensus Estimate of $2.12. The Japanese automaker reported consolidated net income of ¥393.71 billion ($3.86 billion) in second-quarter fiscal 2017, down from ¥611.72 billion ($5.01 billion) posted in the year-ago quarter.
Consolidated revenues decreased 8.6% year over year to ¥6.48 trillion ($63.32 billion) in the reported quarter. The figure also missed the Zacks Consensus Estimate of $64.56 billion.
Unit sales went up 1.4% year over year to 2.19 million vehicles globally. Sales improved 10.3% to 567,640 units in Japan, 5.3% to 211,673 vehicles in Europe and 17.1% to 380,579 units in Asia. Sales inched up 0.1% to 684,985 vehicles in North America but declined 21.3% to 346,001 units in other regions (Central and South America, Oceania, Africa and the Middle East).
Operating income plunged 42.6% to ¥474.6 billion ($4.65 billion) from ¥827.4 billion ($6.78 billion) a year ago. The decline was due to unfavorable foreign exchange rates and increase in expenses, partially offset by cost-reduction efforts and higher sales volumes.
Segment Results
The Automotive segment’s revenues fell 8.7% to ¥5.9 trillion ($57.8 billion) in the reported quarter, while the operating income plunged 44.8% to ¥393.9 billion ($3.23 billion).
The Financial Services segment’s revenues declined 9.9% to ¥432.1 billion ($4.24 billion), while the operating income decreased 35.2% to ¥62 billion ($508.2 million).
All Other businesses’ revenues dropped 3.7% to ¥283.8 billion ($2.78 billion) in the quarter. Operating income increased 12.7% to ¥16.9 billion ($138.5 million).
Financial Position
Toyota had cash and cash equivalents of ¥2.77 trillion ($27.2 billion) as of Sep 30, 2016, compared with ¥2.93 trillion ($25.6 billion) as of Mar 31, 2016. Long-term debt amounted to ¥12.26 trillion ($120.2 billion) as of Sep 30, 2016 compared with ¥13.59 trillion ($113.25 billion) as of Mar 31, 2016.
In the first half of fiscal 2017, operating net cash flow was ¥1.57 trillion ($15 billion) compared with ¥1.96 trillion ($16.1 billion) recorded in the year-ago period. The company declared a quarterly cash dividend of ¥100 (98 cents) per share in the quarter.
FY17 Guidance
Toyota reiterated its consolidated revenue guidance of ¥26 trillion ($252.4 billion) for fiscal 2017. The revenue guidance reflects an 8.5% decline over fiscal 2016.
Operating income guidance has been raised to ¥1.7 trillion ($16.5 billion) from the previous forecast of ¥1.6 trillion ($15.7 billion). The revised guidance implies a 40.4% year-over-year decrease.
Net earnings are expected to be around ¥1.55 trillion ($15 billion), up from the prior view of ¥1.45 trillion ($14.2 billion). The net income guidance reflects expectations of a 33% decrease over fiscal 2016.
TOYOTA MOTOR CP Price, Consensus and EPS Surprise
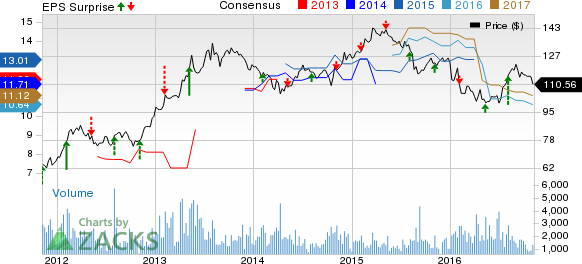
TOYOTA MOTOR CP Price, Consensus and EPS Surprise | TOYOTA MOTOR CP Quote
Zacks Rank
Currently, Toyota carries a Zacks Rank #4 (Sell).
Some better-ranked automobile stocks include Standard Motor Products Inc. (NYSE:SMP) , Visteon Corp. (NYSE:VC) and Gentex Corp. (NASDAQ:GNTX) .
Standard Motor, with a long-term expected growth rate of 15%, sports a Zacks Rank #1 (Strong Buy). You can see the complete list of today’s Zacks #1 Rank stocks here.
Visteon, a Zacks Rank #2 stock, has a long-term growth rate of 23.60%.
Gentex, with a Zacks Rank #2, has a long-term growth rate of 11.17%.
Confidential from Zacks
Beyond this Analyst Blog, would you like to see Zacks' best recommendations that are not available to the public? Our Executive VP, Steve Reitmeister, knows when key trades are about to be triggered and which of our experts has the hottest hand. Click to see them now>>
TOYOTA MOTOR CP (TM): Free Stock Analysis Report
VISTEON CORP (VC): Free Stock Analysis Report
GENTEX CORP (GNTX): Free Stock Analysis Report
STANDARD MOTOR (SMP): Free Stock Analysis Report
Original post
Zacks Investment Research