Tough Retail Earnings Environment
The Q1 earnings season is now effectively behind us, though we are still waiting for reports from 11 S&P 500 companies. We will see results this holiday-shortened week from 71 companies in total, including 5 S&P 500 members. The notable companies reporting results this week include Michael Kors (NYSE:KORS), AutoZone (NYSE:AZO), Costco (NASDAQ:COST), Toll Brothers (NYSE:TOL) and others.
Most of the remaining Q1 earnings reports are from the consumer-centric sectors, primarily the Retail sector. The coming reports are unlikely to change the picture that has emerged from the reports thus far. Strong results from a couple of retailers notwithstanding, it has been a tough environment for the sector. The sector’s weak stock price performance year to date, the weakest among the 16 Zacks sectors, reflects this reality. Retail sector stocks in the S&P 500 are down -5.3% year to date, which compares to positive +3.2% gain for the S&P 500 index as a whole in that same time period.
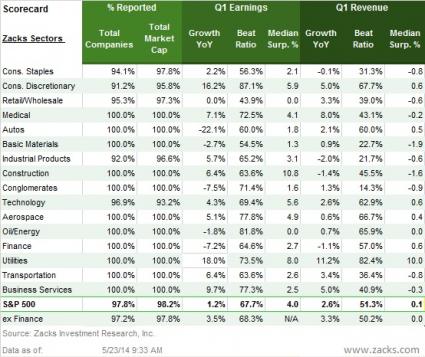
Total earnings for the 41 retailers in the S&P 500 that have reported results already (out of a total of 43) are flat +0.0% on +3.3% higher revenues, with a low 43.9% of them beating earnings estimates and an even lower 39.0% coming ahead of top-line expectations. Combining the Retail sector earnings for the 41 companies that have come out with the 2 still to come, the sector’s total earnings in Q1 should be up 0.4% on +3.7% higher revenues and lower margins. Same-store sales improved markedly in April, with pent up demand following Q1’s harsh weather and the Easter shift benefiting the numbers.
The broad trends about the Q1 earnings are fairly well established by now and the coming reports are unlikely to change them in any material way. These trends pertain to anemic growth, fewer top-line surprises and continued negative guidance that is prompting estimates for the current period to come down.
Scorecard for 2014 Q1 (as of Friday, May 23rd)
Total earnings for the 489 S&P 500 members that have reported results are up 1.2% from the same period last year, with a ‘beat ratio’ of 67.7% and a median surprise of +3.96%. Total revenues are up +2.6%, with a revenue ‘beat ratio’ of 51.3% and the median company beating top-line expectations by 0.13%.
The table below shows the current scorecard for all 16 Zacks sectors. As you can see, the earnings season has come to an end for 11 of the 16 Zacks sectors, with results from just 1.8% of the index’s total market capitalization still awaited.

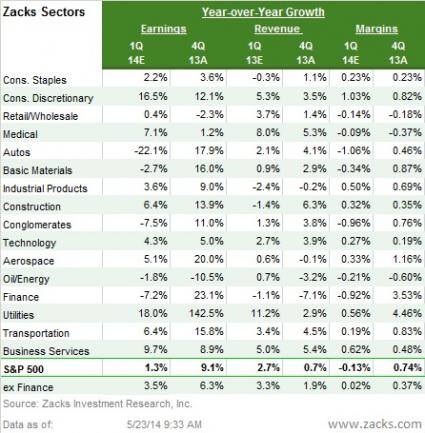
The chart below shows how the earnings and revenue growth rates for Q1 thus far compare to what these same companies reported in 2013 Q4 and the 4-quarter average.

The Q1 earnings growth picture is no doubt weak. But we should keep two things in mind while evaluating this growth picture. Firstly, it wasn’t news to the market, as expectations had fallen sharply ahead of the start of the reporting season. As such, as shocking as the above picture seems to be, nobody was exactly shocked at seeing them. Secondly, the growth picture actually isn’t as bad as the above picture is making it out to be once the drag from the Finance sector (which itself is a function of weak results at Bank of America) is excluded from the aggregate results.
The comparison chart below of ex-Finance results clearly shows this.

This chart of ex-Finance growth is showing that the earnings and revenue growth rates in Q1 are roughly comparable to historical averages. Nothing exciting about that finding, but it is actually an improvement over what was expected just a couple of weeks back.
Looking at the composite Q1 picture, meaning combining the actual results from the 489 companies that have reported with estimates for the 11 still-to-come reports, total earnings are expected to be up 1.3% on +2.7% higher revenues. The table below presents the (composite) summary picture for Q1, showing the year-over-year change in total earnings, revenues and margins for all 16 Zacks sectors.

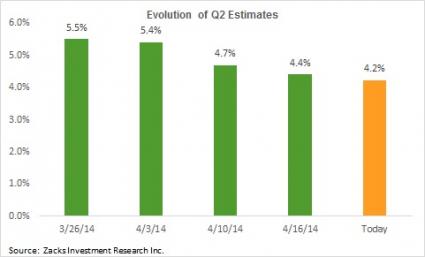
As we saw in the Q1 results, the low expectations made it easy for companies to come out ahead of them. Roughly two-thirds of the S&P 500 members beat earnings expectations every quarter any way and we are right around that level in Q1 as well. What we haven’t seen for a while is positive guidance and favorable comments from management teams about business outlook. And Q1 is largely along those same lines, causing estimates for the current period to come down, as the chart below of evolving Q2 estimates shows.

The downtrend in Q2 estimates is consistent with the trend that has been in place for almost two years now. Stocks made impressive gains over the last two years even though estimates were coming down during that time period, with the Fed QE keeping alive hopes of an eventual growth recovery. It will be interesting to see if investors will respond any differently to the coming period of negative revisions.
Monday-5/26
- Memorial Day, markets closed.
Tuesday -5/27
- We will get the April Durable Goods Orders report in the morning, with expectations of a -0.6% ‘headline’ decline after March’s strong +2.5% gain. Also on tap is the March Case-shiller home price index.
- AutoZone and Jinkosolar Holdings (NYSE:JKS) are the only notable companies reporting in the morning, while Workday (NYSE:WDAY) and Wet Seal (NASDAQ:WTSL) will report after the close.
Wednesday-5/28
- Nothing on the economic calendar, Michael Kors , Toll Brothers and Cracker Barrel (NASDAQ:CBRL) will report Q1 results in the morning, while Palo Alto Network (NYSE:PANW) will report after the close.
Thursday -5/29
- We will get the first revision to Q1 GDP, which is expected to show a modes negative revision to the advanced ‘flat’ reading. Weekly Jobless Claims and Pending Home sales will be the other economic reports coming out today.
- Costco and Abercrombie & Fitch (NYSE:ANF) are the reports in the morning, while Guess (NYSE:GES) and Lions Gate Entertainment (Lions Gate Entertainment (NYSE:LGF) will report after the close.
- Zacks Earnings ESP or Expected Surprise Prediction, our proprietary leading indicator of positive earnings surprises, is showing ANF coming out with a positive earnings surprise.
- Our research shows that companies with Zacks Rank of 1, 2 or 3 and positive Earnings ESP are highly likely of beating EPS estimates. ANF currently has Zacks Rank #3 (Hold) and Earnings ESP of +22.2%.
Friday-5/30
- Will get the Personal Income & Outlays and the Chicago PMI readings, in addition to the final May University of Michigan Consumer Sentiment survey.
- Consumer spending is expected to have increase +0.2% in April after March’s +0.9% gain.
- Big Lots (NYSE:BIG) and Ann (NYSE:ANN) are the only notable reports today.
Here is a list of the 71 companies reporting this week, including 5 S&P 500 members.
| Company | Ticker | Current Qtr | Year-Ago Qtr | Last EPS Surprise % | Report Day | Time |
| AUTOZONE INC | AZO | 8.46 | 7.27 | 1.26 | Tuesday | BTO |
| BANK OF NOVA SC | BNS | 1.2 | 1.2 | 0.83 | Tuesday | BTO |
| AMERICAS CAR-MT | CRMT | 0.66 | 0.92 | -5.56 | Tuesday | AMC |
| FRONTLINE LTD | FRO | 0.04 | -0.35 | 0 | Tuesday | BTO |
| SUNGY MOBILE | GOMO | 0.15 | N/A | -36.84 | Tuesday | AMC |
| JINKOSOLAR HLDG | JKS | 0.41 | -0.56 | 52.33 | Tuesday | BTO |
| MOBILE TELE-ADR | MBT | 0.46 | 0.4 | 28.57 | Tuesday | BTO |
| QIHOO 360 TECH | QIHU | 0.22 | 0.04 | -44.83 | Tuesday | AMC |
| SARATOGA INVEST | SAR | 0.44 | 0.44 | 36.36 | Tuesday | AMC |
| SHIP FIN INTL | SFL | 0.31 | 0.17 | 10.53 | Tuesday | BTO |
| WORKDAY INC-A | WDAY | -0.28 | -0.2 | -3.85 | Tuesday | AMC |
| WET SEAL INC -A | WTSL | -0.18 | 0.01 | 4.17 | Tuesday | AMC |
| APPLIED GEN TEC | AGTC | -0.23 | N/A | N/A | Wednesday | AMC |
| BANK MONTREAL | BMO | 1.38 | 1.41 | 5.84 | Wednesday | BTO |
| BROWN SHOE CO | BWS | 0.31 | 0.32 | 75 | Wednesday | BTO |
| CRACKER BARREL | CBRL | 1.22 | 1.02 | 0 | Wednesday | BTO |
| CHICOS FAS INC | CHS | 0.29 | 0.32 | -75 | Wednesday | BTO |
| CHINA SUNERGY | CSUN | -0.84 | -1.67 | 29.73 | Wednesday | BTO |
| DAKTRONICS INC | DAKT | 0.18 | 0.04 | -30 | Wednesday | BTO |
| DSW INC CL-A | DSW | 0.48 | 0.5 | 6.9 | Wednesday | BTO |
| GOLAR LNG LTD | GLNG | -0.01 | 0.53 | 14.29 | Wednesday | BTO |
| GOLAR LNG PARTN | GMLP | 0.48 | 0.78 | 96.55 | Wednesday | BTO |
| MICHAEL KORS | KORS | 0.68 | 0.5 | 29.07 | Wednesday | BTO |
| NORTH ATL DRILG | NADL | 0.16 | N/A | N/A | Wednesday | BTO |
| NATL BK CDA | NTIOF | 0.93 | 1 | 2.08 | Wednesday | N/A |
| PALO ALTO NETWK | PANW | -0.06 | -0.1 | -500 | Wednesday | AMC |
| POPEYES LA KTCH | PLKI | 0.45 | 0.4 | -3.23 | Wednesday | AMC |
| RBC BEARINGS | ROLL | 0.71 | 0.69 | -16.67 | Wednesday | BTO |
| SAFE BULKERS | SB | 0.09 | 0.21 | 100 | Wednesday | AMC |
| SEADRILL PTNRS | SDLP | 0.43 | 0.83 | 145 | Wednesday | BTO |
| SEADRILL LTD | SDRL | 0.7 | 0.69 | -37.18 | Wednesday | BTO |
| TILLYS INC | TLYS | 0.02 | 0.08 | 5.56 | Wednesday | AMC |
| TOLL BROTHERS | TOL | 0.25 | 0.07 | 38.89 | Wednesday | BTO |
| AMERCO INC | UHAL | 1.71 | 1.93 | 3.09 | Wednesday | AMC |
| ABERCROMBIE | ANF | -0.18 | -0.09 | 28.85 | Thursday | BTO |
| AVAGO TECHNOLOG | AVGO | 0.67 | 0.54 | 7.14 | Thursday | AMC |
| INFOBLOX INC | BLOX | -0.14 | 0 | -16.67 | Thursday | AMC |
| BONA FILM-ADR | BONA | 0.01 | 0.01 | -50 | Thursday | AMC |
| CDN IMPL BK | CM | 1.9 | 2.04 | 7.77 | Thursday | N/A |
| COSTCO WHOLE CP | COST | 1.09 | 1.04 | -10.26 | Thursday | BTO |
| DESCARTES SYS | DSGX | 0.06 | 0.04 | 33.33 | Thursday | BTO |
| DESTINATION XL | DXLG | -0.06 | 0.05 | 100 | Thursday | BTO |
| ENVIVIO INC | ENVI | -0.09 | -0.18 | 42.86 | Thursday | AMC |
| ESTERLINE TECHN | ESL | 1.32 | 1.12 | 1.89 | Thursday | AMC |
| EXA CORP | EXA | -0.06 | -0.04 | 20 | Thursday | AMC |
| EXPRESS INC | EXPR | 0.14 | 0.38 | -3.39 | Thursday | AMC |
| FREDS INC | FRED | 0.2 | 0.31 | 21.43 | Thursday | BTO |
| FAIRWAY GROUP | FWM | -0.19 | -0.09 | -9.09 | Thursday | AMC |
| GUESS INC | GES | -0.06 | 0.14 | 3.75 | Thursday | AMC |
| IAO KUN GROUP | IKGH | 0.13 | 0.38 | -220 | Thursday | BTO |
| LIONS GATE ETMT | LGF | 0.39 | 0.52 | 15.69 | Thursday | AMC |
| MODINE MANUFACT | MOD | 0.1 | 0.18 | 166.67 | Thursday | BTO |
| NIMBLE STORAGE | NMBL | -0.16 | N/A | -27.78 | Thursday | AMC |
| CHINA NEPSTAR | NPD | N/A | 0.01 | N/A | Thursday | BTO |
| OMNIVISION TECH | OVTI | 0.12 | 0.17 | 166.67 | Thursday | AMC |
| PALL CORP | PLL | 0.83 | 0.74 | 2.5 | Thursday | BTO |
| PAC SUNWEAR CAL | PSUN | -0.13 | -0.14 | 5.56 | Thursday | AMC |
| QAD INC-A | QADA | -0.02 | -0.08 | 92.86 | Thursday | AMC |
| QUALITY SYS | QSII | 0.16 | 0.21 | -52.38 | Thursday | BTO |
| SANDERSON FARMS | SAFM | 1.64 | 1.06 | 32.98 | Thursday | BTO |
| STAR BULK CARRS | SBLK | 0.05 | 0.5 | -14.29 | Thursday | BTO |
| RENESOLA LT-ADR | SOL | -0.05 | -0.45 | 72.73 | Thursday | BTO |
| SPLUNK INC | SPLK | -0.26 | -0.16 | -285.71 | Thursday | AMC |
| TECH DATA CORP | TECD | 0.9 | N/A | 7.69 | Thursday | BTO |
| THERMON GROUP | THR | 0.31 | 0.18 | 2.78 | Thursday | BTO |
| TATA MOTORS-ADR | TTM | N/A | 1.14 | 41.38 | Thursday | N/A |
| VEEVA SYSTEMS-A | VEEV | 0.05 | N/A | -33.33 | Thursday | AMC |
| VIOLIN MEMORY | VMEM | -0.37 | N/A | -47.06 | Friday | AMC |
| ANN INC | ANN | 0.34 | 0.44 | 42.86 | Friday | BTO |
| BIG LOTS INC | BIG | 0.44 | 0.61 | 0 | Friday | BTO |
| GRAHAM CORP | GHM | 0.27 | 0.41 | -36.36 | Friday | BTO |
