The stock markets surged Friday on news that the U.S. unemployment rate “SURPRISINGLY” fell to 13.3% in May, down from 14.7% in April. Somehow, with most of the country still on lockdown in May, there were 2.5 million Americans added to the payrolls along with 345,000 new businesses that were formed.
Then, of course, we had President Trump praising, The “V-shaped” recovery that was now taking place in the U.S. Economy. I find this quite hilarious when the U.S. Public debt increased by another cool $830 billion in May alone. Furthermore, if we add that amount to the $1,234 billion added in April, it comes out to be a TAD BIT more than $2 trillion in just the past two months. So, if this is a “V-shaped” recovery, it took one hell of a lot of debt to keep it from heading straight into a depression.
I spent some time looking on my Twitter feed Friday and saw a lot of analysts disputing the U.S. unemployment figures for May:

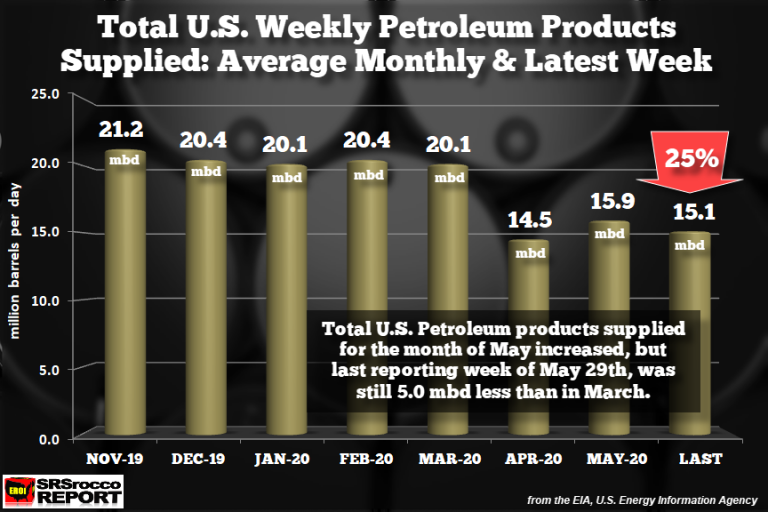
Regardless, while Americans are heading back on the road in their SUVs and Chevy Tahoes, total U.S. petroleum products supplied to the market are still 25% lower than there were in March:

I took the EIA, U.S. Energy Information Agency’s weekly figures, and provide a monthly average in the chart above. The monthly average for December to March was about 20.2 million barrels per day (mbd). However, this fell to an average of 14.5 mbd in April and then increased to 15.9 mbd in May. But, according to the EIA’s most recent update for the week ending May 29th, total U.S. petroleum products supplied fell to only 15.1 mbd.
The largest decline of petroleum products supplied came from the Jet Fuel and Diesel Fuel categories. Motor gasoline product supplied increased by about 300,000 barrels per day, but the total decline from Jet Fuel and Diesel was a little more than 1,000,000 barrels per day. It will be interesting to see the changes in U.S. petroleum products supplied over the next several months as we continue to up that MASSIVE “V-Shaped” Recovery… SARCASM… LOL.
I also looked at how much U.S. total oil production had declined from its peak. According to the EIA, total U.S. crude oil production has fallen from a peak of 13.1 mbd (million barrels per day) to 11.2 mbd, a loss of 1.9 mbd. However, if total U.S. petroleum products supplied are still down roughly 5 mbd, where is the rest of the oil going??
Remember, the U.S. oil supply has only declined by 1.9 mbd from the peak. The difference between the loss of production and products supplied is roughly 3.1 mbd. So again… where is this oil going??
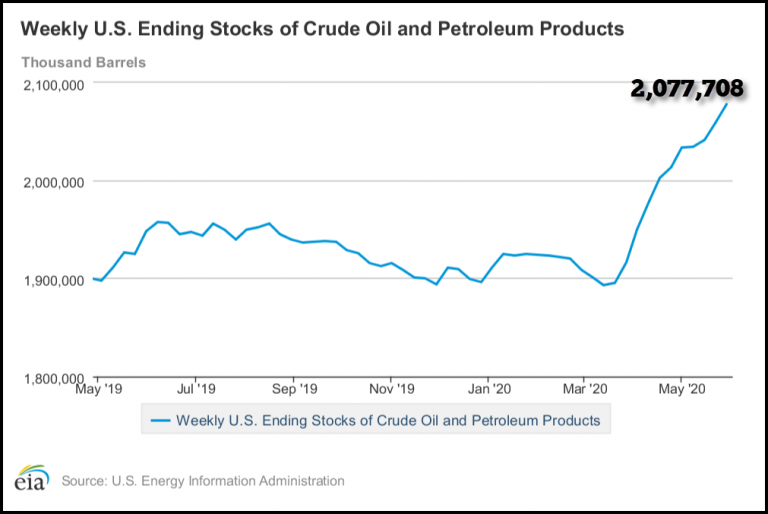
Well… it’s going into the total U.S. oil and petroleum stocks. First, the total U.S. oil and petroleum stocks increased by 19.1 million barrels over the past week. If we divide by SEVEN DAYS, we get 2.7 million barrels per day. So, the U.S. Petroleum Industry is still adding nearly 3 million barrels per day to the country’s total oil-petroleum stocks.
The following chart shows how quickly the stocks have been increasing:

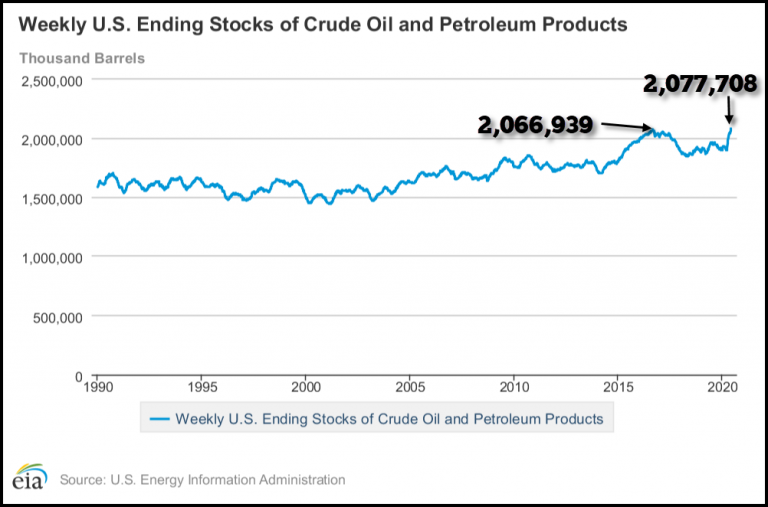
The figures in these charts are in THOUSAND BARRELS. So, the U.S. total oil and petroleum stocks are a bit more than 2 billion barrels. And keeping with the HOPIUM STOCK MARKET mantra, these oil and petroleum stocks reached a new record level this week of 2.078 billion barrels compared to the prior peak of 2.067 billion barrels back in August of 2016:

So, we will see what happens to U.S. oil demand and petroleum inventories over the next few months as we “Supposedly” continue back up the “V-shaped” recovery. Let’s just say… I have my doubts.
