Here's some of the standout economic and markets charts on my radar (originally posted on LinkedIn). I aim to pick a good mix of charts covering key global macro trends, and ones which highlight risks and opportunities across asset classes.
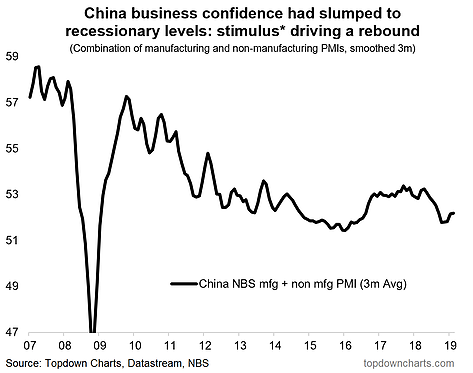
1. China PMIs: We just got the China April PMIs, and the news was probably disappointing to some. If there weren't doubts over China "green shoots" before, there will definitely be doubts now. Both the manufacturing (50.1 vs 50.5) and non-manufacturing (54.3 vs 54.8) were down vs March.
Yet there's a couple of things I'd point out: first is the 3-month rolling average of both PMIs is still up vs the lows and up vs last month (i.e. the trend if you would is higher), another very interesting data point is the export orders sub-index which not only rose vs March, but chalked up a 9-month high. The other thing is both are still above the key 50-point mark. So I would hesitate to throw the towel in on the China story just yet.
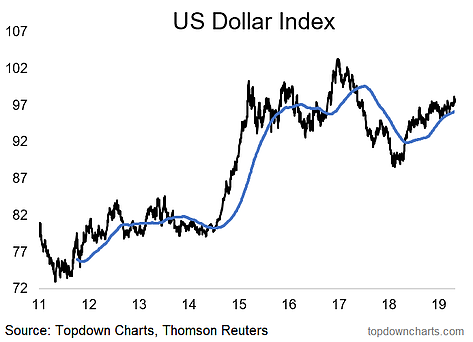
2. US Dollar Index - Breakout or Fakeout? If China PMIs missing didn't rattle you, then the US dollar breakout might have... A stronger US dollar typically ends up driving tighter financial conditions globally as it puts pressure on commodity prices and emerging markets, and indeed was arguably a key driver behind the EM/global stress episode in 2015/16.
I talked about this issue at length in both the Friday macro report and the Monday markets monitor. Basically my take is to be respectful yet skeptical of the breakout. I still lean to the bearish side for the US dollar, but if this turns out to be a fully fledged breakout (vs a fakeout - i.e. failed breakout) then I'm not going to be religious about it...
Chart Source: Global Cross Asset Market Monitor
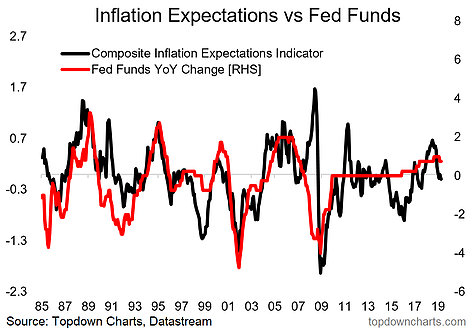
3. Inflation Expectations and the Fed - rate cut time? One thing going against the US dollar is a more dovish Fed, and if this chart is anything to go by (and maybe it's not!) then if anything, the Fed should actually be even more dovish than the market has decided that they are. The chart shows the year-on-year change in the Fed funds rate against our inflation expectations composite. Basically through history the Fed has tended to lift rates when inflation expectations are rising and vice versa. Thus, the recent softness in inflation expectations arguably affords the Fed scope to cut rates.
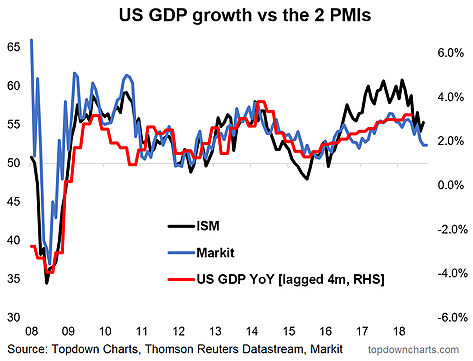
4. US GDP Growth vs the PMIs: Some of you will be thinking after the previous chart, "but what about the strong GDP results?". Indeed it was a decent print, and goes against some of the more bearish narratives that have been floating around and proliferating as market volatility spiked. Yet the PMIs seem to point to at least a period of softer US GDP growth over the next quarter. We're yet to get the final results for April, so I'll leave it at that.
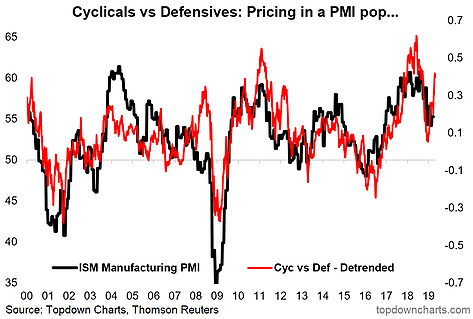
5. Speaking of the US PMI... or will I? Last chart gives some food for thought ahead of the April ISM. If you ask (believe?) US cyclicals vs defensives, they seem to be pricing in a pop in the PMI. They've been wrong before, and sometimes spectacularly (cough-2008-cough), but a 60 handle on the ISM would certainly wake up these sleepy markets! (source)
Thanks for reading, I appreciate your interest in my work.
