
2013 Q2 is complete and the OSV value stock screeners have been on a tear after a poor start to the year.
This is big surprise because a few screens shot up by as much as 30% in Q2 alone.
One thing for sure is that even value strategies can do extremely well in a bullish market. Everything looks rosy at the moment, but let’s see how the screens fare over the two quarters.
Here are the results at the end of 2013 Q2.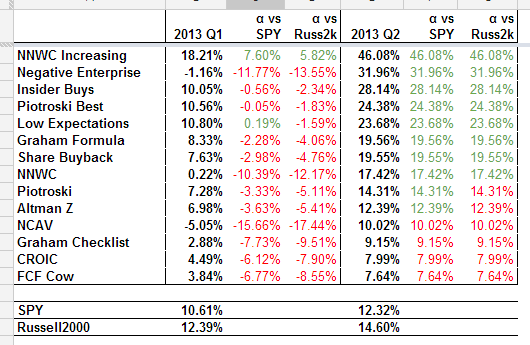
A Look at the Leading Screen
These are the stocks that started 2013 in the NNWC increasing screen. The order is according to the rank produced by the backtest.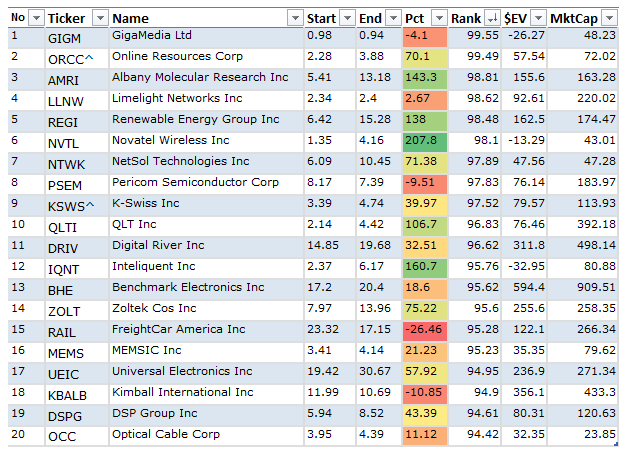
Here is the list again sorted by performance at the end of Q2.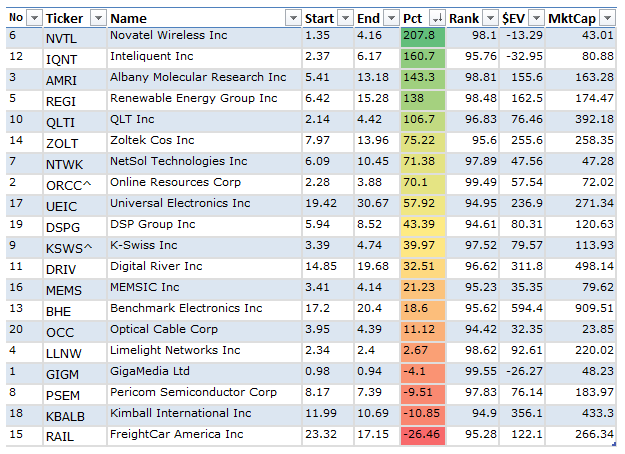
- ORCC and KSWS were bought out and no longer in the screen.
Let me know if any of those stocks interest you and we can start a discussion and analysis in the value forum.
How to Improve Your Own Performance
The screens follow a strict automated process of buying and selling.
But I’m sure you prefer to pick your own stocks. The human judgement has advantages in that you can filter out obvious bad choices.
Here’s an example of what you can do.
Do a process of elimination and then analyze the stocks that remain in finer detail.
You can do this even easier and quicker with the OSV Stock Analyzer.
Eliminate companies outside your circle of competence to reduce the number of stocks from the top 20 to around 10-15.
Then run them through the Stock Analyzer, take about 1-2 minutes to look at quality metrics like CROIC, the DuPont model and Piostroski score.
Toss away the low quality stocks and you should be left with around 5 interesting ideas.
Go through some reports, read some footnotes and you should be left with a few quality ideas that you can watch for a pullback or for purchase.
Much like how Old School Value user Frank was able to nail down LEE and profit from his stock pick.
All this in about 1-2 hours depending on how many ideas you filter down to.
How to Run Your Own Backtest to Create Stock Screens
All the value screens were created and backtested using Portfolio123, an outstanding service if you are serious about creating strategies and testing ideas.
What I love about Portfolio123 is that you can create your own formulas instead of using oversimplified sliders like what you see on the Google Finance screener. Creating your own custom screen is a powerful way to test theories, strategies and be different to the crowd of people using free public screeners.
Also, you can backtest from 1999 with the ability to custom rank stocks.
If you want to create your own, read the How to Backtest article to get started today.
How the Screens are Set Up
- Each screen consists of 20 stocks
- Slippage ranges from 1% for screens with mostly large caps to 3% for small cap screens
- Carry cost is 1.5%
- Long weight is 100%
- Rebalancing only once a year
- No hedging applied
The big difference to the way I set up my screens compared to other sites and services is that I focus on reality.
Turning over a portfolio every 4 weeks or even every quarter is a nightmare in reality unless you are working with a small number of stocks.
The point is not to trade to profits, but to let a systematic and well thought out value strategy work itself out.
The fees associated with having to rebalance every month would kill your performance too.
Next time when you look at how other screens are constructed, consider fees, turnover and real world variables.