There is currently an expanding list of 35 ETFs oriented to the Asia-Pacific market whether in single country funds or with regional issues. The following analysis features a fair representation of regional ETFs available. We believe from these investors may choose an appropriate ETF to satisfy the best index-based offerings individuals and financial advisors may utilize.
It's important investors understand index weightings here more than perhaps in other sectors. Some are heavily weighted toward a single country like Australia or Japan. We prefer a better blend generally despite perhaps better trading and trending characteristics. For example, where an ETF is weighted heavily toward just one or two countries, it might be better to deal with a single country fund rather than an undiversified regional issue. These might include EWA (Australia) or EWJ (Japan) when dealing with popular EPP or VPL.
ETFs are based on indexes tied to well-known index providers including Russell, S&P, Barclays, MSCI, Dow Jones and so forth. Also included are some so-called “enhanced” indexes that attempt to achieve better performance through more active management of the index.
Where competitive issues exist and/or repetitive issues available at a fee cost saving we mention those as other choices. New issues are coming to market consistently (especially globally) and sometimes these issues will need to become more seasoned before they may be included, at least in our listings.
We feature a technical view of conditions from monthly chart views. Simplistically, we recommend longer-term investors stay on the right side of the 12 month simple moving average. When prices are above the moving average, stay long, and when below remain in cash or short. Some more interested in a fundamental approach may not care so much about technical issues preferring instead to buy when prices are perceived as low and sell for other reasons when high; but, this is not our approach. Members to the ETF Digest receive added signals when markets become extended such as DeMark triggers to exit overbought/oversold conditions.
For traders and investors wishing to hedge, leveraged and inverse issues are available to utilize from ProShares and Direxion and where available these are noted.![]()
FNI follows the ISE Chindia Index which consists of 50 ADRs, ADSs and/or stocks of companies that are listed in either China or India. The fund was launched in May 2007. The expense ratio is 0.60%. AUM equal $65M and average daily trading volume is 17K shares. As July 2012 the annual dividend yield was 2.32% and YTD return was 0.91%. The one-year return was -26.95%.
Note: Marrying the two markets has seductive qualities but they’re two different economies and political structures.
Data as of June 2012
FNI Top Ten Holdings
. HDFC Bank Ltd ADR (HDB): 7.62%
. ICICI Bank Ltd ADR (IBN): 7.50%
. PetroChina Co Ltd ADR (PTR): 7.49%
. China Mobile Ltd. ADR (CHL): 7.16%
. Baidu, Inc. ADR (BIDU): 6.37%
. Melco Crown Entertainment Ltd ADR (MPEL): 6.04%
. Tata Motors, Ltd. ADR (TTM): 5.91%
. Infosys Ltd ADR (INFY): 5.65%
. CNOOC, Ltd. ADR (CEO): 3.91%
. Sterlite Industries (India), Ltd. ADR (SLT): 3.68%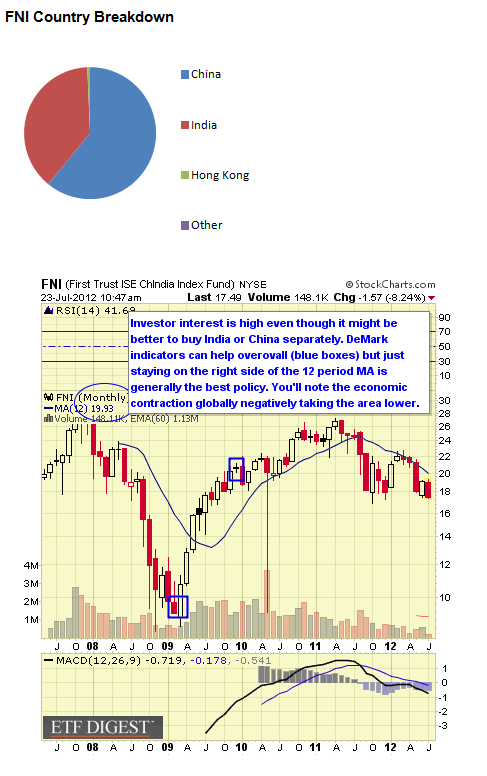
![]()
ADRA follows the Bank of New York Mellon Asia 50 ADR Index covering 50 different Asian market-based depository receipts. The fund was launched in November 2002. The expense ratio is 0.30%. AUM equal $26.8M and average daily trading volume is 2K shares. As July 2012 the annual dividend yield was 2.80% and YTD return was 2.24%. The one year return was -16.80%.
Note: The fund has lost 50% of AUM since the peak in the summer of 2011 and daily volume is quite low. Be cautious with this ETF for these reasons. At the same time you’ll note a low expense ratio, decent dividend at these levels and holdings dominated by large companies.
Data as of June 2012
ADRA Top Ten Holdings And Weightings
. Toyota Motor Corp ADR (TM): 10.11%
. BHP Billiton Ltd ADR (BHP): 10.07%
. Taiwan Semiconductor Manufacturing ADR (TSM): 6.40%
. Westpac Banking Corp ADR (WBK): 6.06%
. Mitsubishi UFJ Financial Group, Inc. ADR (MTU): 5.68%
. Honda Motor Co Ltd ADR (HMC): 5.48%
. China Mobile Ltd. ADR (CHL): 4.18%
. Canon, Inc. ADR (CAJ): 3.84%
. Sumitomo Mitsui Financial Group Inc ADR (SMFG): 3.83%
. Mizuho Financial Group Inc ADR (MFG): 3.20%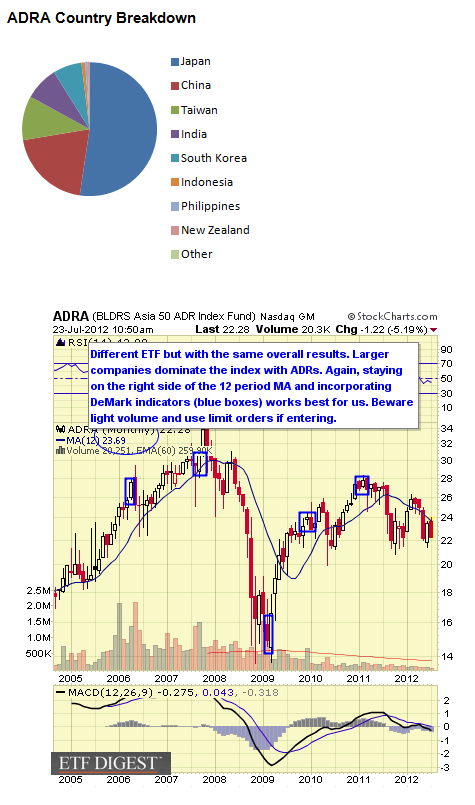
![]()
VPL tracks the MSCI Pacific Index which includes the region ranging from Japan (58%) and Australia (26%) with the rest divided between markets like Hong Kong, New Zealand and Singapore. The fund was launched in March 2005. The expense ratio is 0.14%. AUM equal $1.5B and average daily trading volume is 174K shares. As of July 2012 the annual dividend yield was 3.16% and YTD return was 3.24%. The one year return was -12.34%. VPL trades commission free at Vanguard.
Nearly 80% of weightings in Japan and Australia which isn’t very diversified in our opinion.
Data as of June 2012
VPL Top Ten Holdings And Weightings
. Toyota Motor Corporation (7203): 3.28%
. BHP Billiton Limited (BHPLF): 3.16%
. Commonwealth Bank of Australia (CBA): 2.23%
. Westpac Banking Corp (WBC): 1.88%
. Mitsubishi UFJ Financial Group, Inc. (MBFJF): 1.75%
. Australia & New Zealand Banking Grp Ltd. (ANEWF): 1.74%
. Honda Motor Company (7267): 1.72%
. National Australia Bank Limited (NAB): 1.54%
. Canon, Inc. (CAJFF): 1.48%
. Sumitomo Mitsui Financial Group, Inc. (SMFNF): 1.21%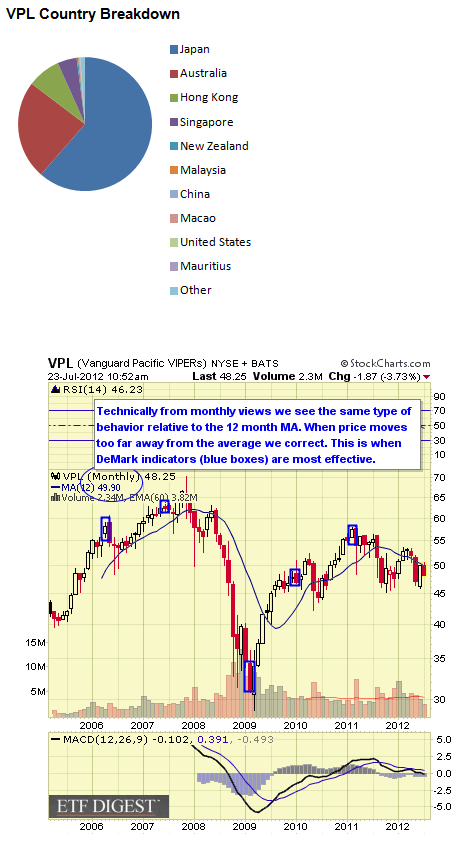
![]()
EPP follows the MSCI Pacific ex-Japan Index which follows a blend of Australia, Hong Kong, New Zealand and Singapore equity markets with a heavy weighting toward Australia (65%). The fund was launched in October 2001. The expense ratio is 0.50%. AUM (Assets under Management) equal $3.1B and average daily trading volume is over 556K shares. As of July 2012 the annual dividend yield was 4.38% and YTD return was 9.51%. The one year return was -8.10%.
While bigger may be better sometimes I just think you could buy EWA (Australia) and marry it with another regional issue. Further, and perhaps more than others, the level of commodity prices can affect positively or negatively with high Australia exposure.
For investors interested in hedging or speculating ProShares features leveraged long and short ETFs linked to this index.
Data as of June 2012
EPP Top Ten Holdings And Weightings
. BHP Billiton Ltd (BHPLF): 8.09%
. Commonwealth Bank of Australia (CBA): 6.14%
. Westpac Banking Corp (WBC): 4.85%
. Australia and New Zealand Banking Group Limited (ANEWF): 4.34%
. National Australia Bank Limited (NAB): 3.91%
. Woolworths Limited (WOLWF): 2.55%
. Wesfarmers Ltd (WES): 2.31%
. AIA Group Ltd. (01299): 2.23%
. Rio Tinto Ltd (RIO): 1.96%
. Woodside Petroleum Limited (WOPEF): 1.63%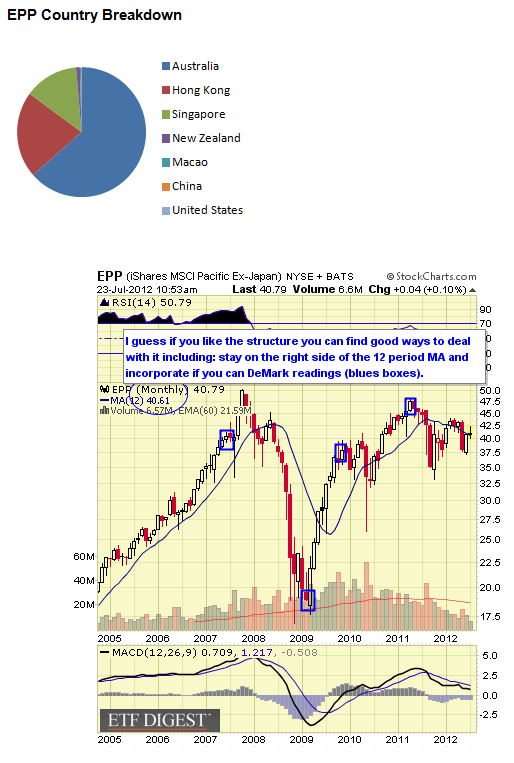
![]()
ASEA follows the FTSE/ASEAN 40 Index which measures the 40 largest companies in five ASEAN regions: Indonesia, Philippines, Singapore, Malaysia and Thailand. The fund was launched in February 2011. The expense ratio is 0.65%. AUM equal $29M and average daily trading volume is near 16K shares. As of July 2012 the annual dividend yield was 2.29% and YTD return was 10.65%. The one year return was -5.59%. ASEA trades commission free at E*Trade and Interactive Brokers.
Another note: this is a relatively new ETF and even with market turmoil AUM has grown. It’s included here because the structure is important, unique and covers an important sector overall. Nevertheless, trading is light and as with others like this you need to be cautious with trading orders sticking to limit versus market orders.
Data as of June 2012
ASEA Top Ten Holdings And Weightings
. Astra International Tbk (ASII): 6.19%
. Singapore Telecommunications Limited (Z74): 5.67%
. DBS Group Holdings Ltd (D05): 5.43%
. Oversea-Chinese Banking Corp Ltd (OVCHF): 5.04%
. United Overseas Bank Ltd. (U11): 4.73%
. Malayan Banking Berhad (1155): 4.64%
. Public Bank Bhd Foreign Registered (PUBNF): 4.56%
. Sime Darby Bhd. (4197): 4.02%
. CIMB Group Holdings Bhd. (1023): 3.85%
. Keppel Corp Ltd (KPELF): 3.15%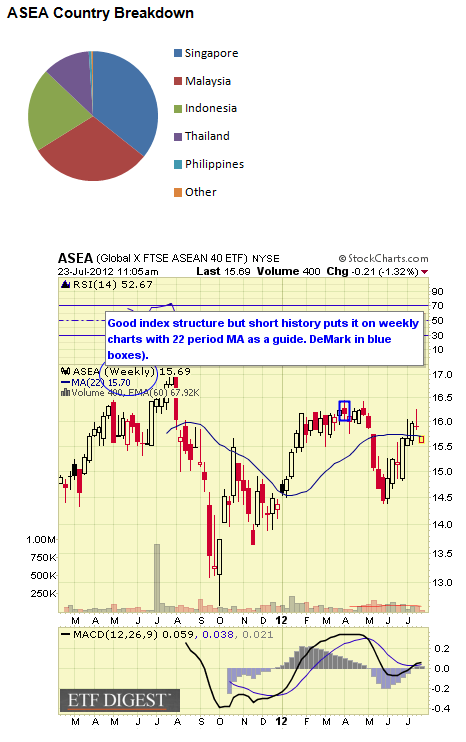
![]()
PAF follows the FTSE RAFI Developed Asia Pacific ex-Japan Index which is designed to track the largest equities in the region selected on four fundamental measures: book value, income, sales and dividends. The fund was launched in June 2007. The expense ratio is 0.80%. AUM equal $54M and average daily trading volume is 4.2K6K shares. As of July 2012 the annual dividend yield was 3.07% and YTD return was 6.05%. The one year return was -13.20%.
As an additional note, I wouldn’t find it too off-putting given lower AUM data. $25M is the minimum for a successful ETF. As for liquidity issues you should be precise in your orders placing limit orders to buy or sell.
Data as of June 2012
PAF Top Ten Holdings And Weightings
. Samsung Electronics Co Ltd (SSNLF): 6.97%
. BHP Billiton Ltd (BHPLF): 4.00%
. National Australia Bank Limited (NAB): 3.83%
. Commonwealth Bank of Australia (CBA): 3.77%
. Westpac Banking Corp (WBC): 3.49%
. Australia and New Zealand Banking Group Limited (ANEWF): 3.23%
. Hyundai Motor Co Ltd (005380): 2.50%
. POSCO (005490): 2.23%
. Hutchison Whampoa Ltd H Shares (00013): 1.85%
. Woolworths Limited (WOLWF): 1.58%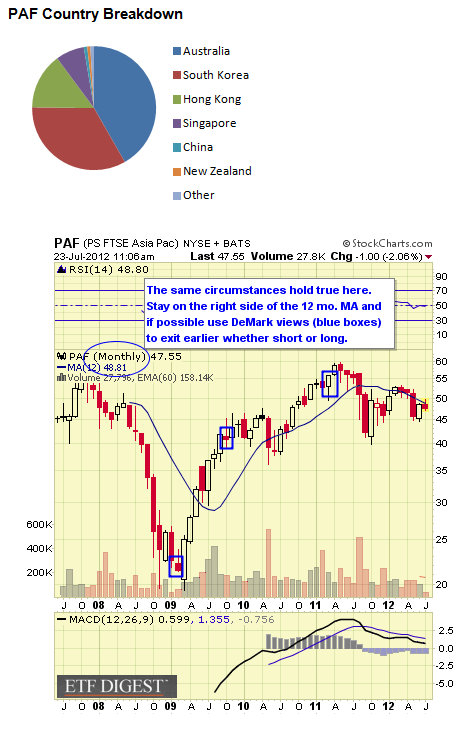
![]()
follows the WisdomTree Asia Pacific ex-Japan Index which is a fundamentally weighted index following the top 300 dividend paying companies in the region and ranked by market capitalization. The fund was launched in June 2006. The expense ratio is 0.48%. AUM equal $83.9M and average daily trading volume is 7K shares.
As of July 2012 the annual dividend yield was 3.49% and YTD return was 8.12%. The one year return was -5.70%. AXJL trades commission free at E*Trade.
Data as of June 2012
AXJL Top Ten Holdings And Weightings
. China Mobile Ltd. (00941): 8.09%
. China Construction Bank Corp H Shares (00939): 4.46%
. Commonwealth Bank of Australia (CBA): 3.41%
. Westpac Banking Corp (WBC): 3.10%
. Telstra Corp Ltd (TTRAF): 2.98%
. Taiwan Semiconductor Manufacturing (2330): 2.66%
. Australia and New Zealand Banking Group Limited (ANEWF): 2.50%
. WisdomTree India Earnings: 2.22%
. National Australia Bank Limited (NAB): 2.12%
. CNOOC, Ltd. (00883): 1.85%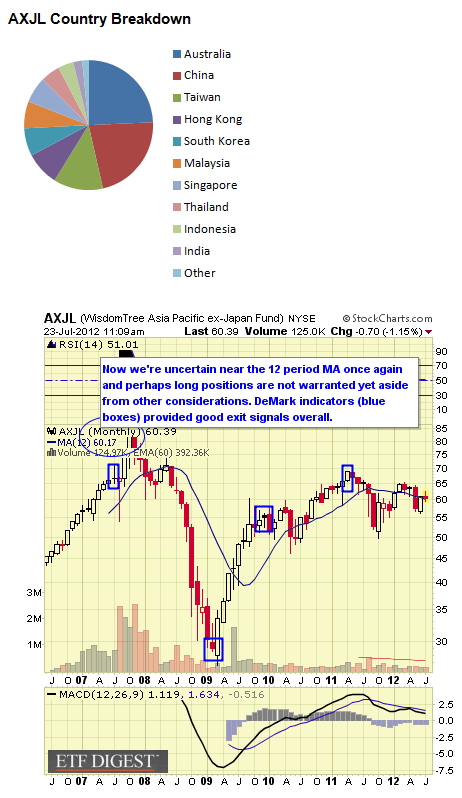
![]()
AIA follows the S&P Asia 50 Index which the 50 leading companies from Hong Kong, South Korea, Singapore and Taiwan. The fund was launched in November 2007. The expense ratio is 0.50%.
AUM equal $186M and average daily trading volume is 20K shares. As of July 2012 the annual dividend yield was 2.76% and YTD return was 5.56%. The one year return was -10.61%.
Data as of June 2012
AIA Top Ten Holdings And Weightings
. Samsung Electronics Co Ltd (SSNLF): 14.99%
. Taiwan Semiconductor Manufacturing (2330): 7.30%
. China Mobile Ltd. (00941): 5.18%
. China Construction Bank Corp H Shares (00939): 4.94%
. Industrial And Commercial Bank Of China Ltd. (01398): 3.66%
. Hyundai Motor Co Ltd (005380): 3.58%
. CNOOC, Ltd. (00883): 2.85%
. Hon Hai Precision Ind. Co., Ltd. (2317): 2.69%
. PetroChina Co Ltd H Shares (00857): 2.64%
. AIA Group Ltd. (01299): 2.60%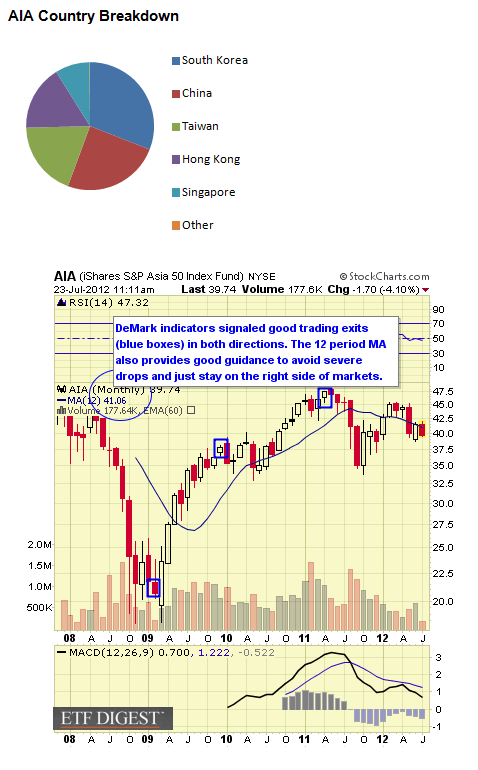
![]()
GMF follows the S&P Asia Pacific Emerging BMI Index which includes publicly traded companies throughout emerging Asian Pacific markets. The fund was launched in March 2007. The expense ratio is 0.59%.
AUM equal $381M and average daily trading volume is 50K shares. As July 2012 the annual dividend yield was 3.86% and YTD return was 2.58%. The one year return was -17.86%.
Data as of June 2012
GMF Top Ten Holdings And Weightings
. Taiwan Semiconductor Manufacturing ADR (TSM): 3.99%
. China Mobile Ltd. (00941): 2.91%
. China Construction Bank Corp H Shares (00939): 2.79%
. Industrial And Commercial Bank Of China Ltd. (01398): 1.91%
. Baidu, Inc. ADR (BIDU): 1.90%
. PetroChina Co Ltd H Shares (00857): 1.84%
. Hon Hai Precision Ind. Co., Ltd. (2317): 1.62%
. CNOOC, Ltd. (00883): 1.60%
. Bank Of China Ltd. H Shares (BACHF): 1.35%
. Infosys Ltd ADR (INFY): 1.31%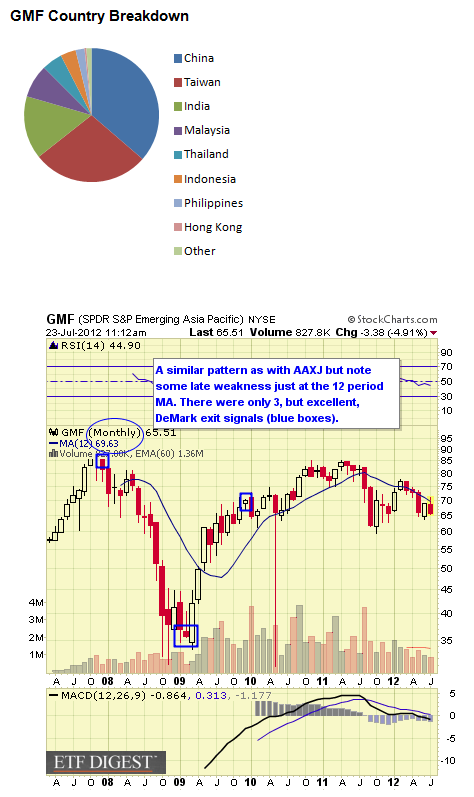
![]()
AAXJ follows the MSCI All Country Asia ex-Japan Index which includes the performance of 11 developed and emerging Asian equity markets. The fund was launched in August 2008. The expense ratio is 0.74%.
AUM equal nearly $1.7B and average daily trading volume is 652K shares. As of July 2012 the annual dividend yield was 1.72% and YTD return was 5.09%. The one year return was -15.62%. AAXJ trades commission free at TD Ameritrade.
Data as of June 2012
AAXJ Top Ten Holdings And Weightings
. Samsung Electronics Co Ltd (SSNLF): 4.75%
. Taiwan Semiconductor Manufacturing (2330): 2.94%
. China Mobile Ltd. (00941): 2.58%
. China Construction Bank Corp H Shares (00939): 1.74%
. Industrial And Commercial Bank Of China Ltd. (01398): 1.56%
. CNOOC, Ltd. (00883): 1.36%
. Hyundai Motor Co Ltd (005380): 1.34%
. Tencent Holdings Ltd. (00700): 1.18%
. PetroChina Co Ltd H Shares (00857): 1.14%
. AIA Group Ltd. (01299): 1.14%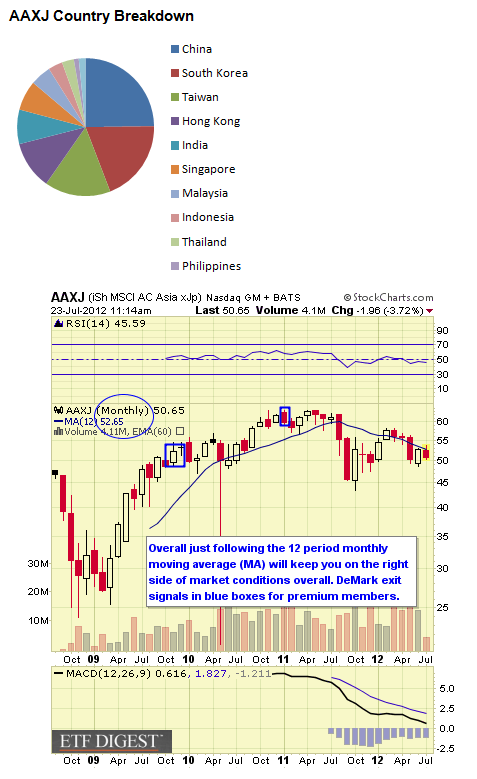
Note On Rankings
We rank the top 10 ETF by our proprietary stars system as outlined below. However, given that we’re sorting these by both short and intermediate issues we have split the rankings as we move from one classification to another.
Strong established linked index
Excellent consistent performance and index tracking
Low fee structure
Strong portfolio suitability
Excellent liquidity![]()
Established linked index even if “enhanced”
Good performance or more volatile if “enhanced” index
Average to higher fee structure
Good portfolio suitability or more active management if “enhanced” index
Decent liquidity![]()
Enhanced or seasoned index
Less consistent performance and more volatile
Fees higher than average
Portfolio suitability would need more active trading
Average to below average liquidity![]()
Index is new
Issue is new and needs seasoning
Fees are high
Portfolio suitability also needs seasoning
Liquidity below average
For the last decade the Asia-Pacific region has offered the best prospects for economic growth and potential investment returns. These markets have been more volatile historically but have seen this become reduced in the past few years as markets have become more developed than previously. But in the fall of 2011 the higher volatility returned causing sharper losses in this sector than more established markets. Nevertheless, with better economic growth inflation fears will rise and authorities have been trying to contain these by increasing interest rates and/or raising bank reserves. Now economies may be moving toward either reduced economic growth. Nevertheless global markets are highly correlated making trends overall similar despite greater volatility.
It’s also important to remember that ETF sponsors have their own competitive business interests when issuing products which may not necessarily align with your investment needs. New ETFs from highly regarded and substantial new providers are also being issued. These may include Charles Schwab’s ETFs and Scottrade’s Focus Shares which both are issuing new ETFs with low expense ratios and commission free trading at their respective firms. These may also become popular as they become seasoned.
Disclosure: The ETF Digest has no current positions in the featured ETFs.
(Source for data is from ETF sponsors and various ETF data providers.)
- English (UK)
- English (India)
- English (Canada)
- English (Australia)
- English (South Africa)
- English (Philippines)
- English (Nigeria)
- Deutsch
- Español (España)
- Español (México)
- Français
- Italiano
- Nederlands
- Português (Portugal)
- Polski
- Português (Brasil)
- Русский
- Türkçe
- العربية
- Ελληνικά
- Svenska
- Suomi
- עברית
- 日本語
- 한국어
- 简体中文
- 繁體中文
- Bahasa Indonesia
- Bahasa Melayu
- ไทย
- Tiếng Việt
- हिंदी
Top 10 Asia-Pacific Regional ETFs
Published 07/24/2012, 05:16 AM
Updated 05/14/2017, 06:45 AM
Top 10 Asia-Pacific Regional ETFs
3rd party Ad. Not an offer or recommendation by Investing.com. See disclosure here or
remove ads
.
Latest comments
Install Our App
Risk Disclosure: Trading in financial instruments and/or cryptocurrencies involves high risks including the risk of losing some, or all, of your investment amount, and may not be suitable for all investors. Prices of cryptocurrencies are extremely volatile and may be affected by external factors such as financial, regulatory or political events. Trading on margin increases the financial risks.
Before deciding to trade in financial instrument or cryptocurrencies you should be fully informed of the risks and costs associated with trading the financial markets, carefully consider your investment objectives, level of experience, and risk appetite, and seek professional advice where needed.
Fusion Media would like to remind you that the data contained in this website is not necessarily real-time nor accurate. The data and prices on the website are not necessarily provided by any market or exchange, but may be provided by market makers, and so prices may not be accurate and may differ from the actual price at any given market, meaning prices are indicative and not appropriate for trading purposes. Fusion Media and any provider of the data contained in this website will not accept liability for any loss or damage as a result of your trading, or your reliance on the information contained within this website.
It is prohibited to use, store, reproduce, display, modify, transmit or distribute the data contained in this website without the explicit prior written permission of Fusion Media and/or the data provider. All intellectual property rights are reserved by the providers and/or the exchange providing the data contained in this website.
Fusion Media may be compensated by the advertisers that appear on the website, based on your interaction with the advertisements or advertisers.
© 2007-2024 - Fusion Media Limited. All Rights Reserved.
