Tinexta's (MI:TNXT) interim results confirmed the outlook is positive for its two largest and most profitable divisions, Digital Trust and Innovation & Marketing Services. Overall revenue and profit growth for the group was slower in Q2 than in Q1, mainly due to one-off costs and a decline in Credit Information & Management. We maintain our PBT forecasts for FY19 and increase our FY20 forecast by 1%. Our DCF-based valuation increases to €14.6 per share (from €14.2), which offers 17% potential upside from the current share price.

Digital Trust and Innovation & Marketing Services lead the way
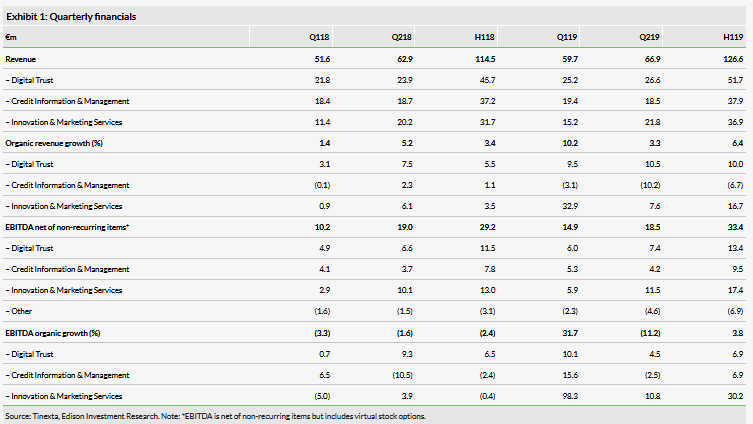
While group Q219 organic revenue growth was 3.3% vs the 10.2% reported for Q119, growth remained strong in the two most important divisions, 10.5% in Digital Trust and 7.6% in Innovation & Marketing Services. On the other hand, the decline in Credit Information & Management accelerated in Q219, although good cost control resulted in an increase in margin. Group EBITDA net of non-recurring items (including ‘virtual stock options’, which were extraordinarily large during the period) declined organically by 11% in Q2. Most importantly the operating margin remained healthy. Excluding this charge, adjusted EBITDA for the group in H119 was €35.7m, a margin of 28.2% versus 25.6% in H118.
Our upgraded forecasts remain above guidance
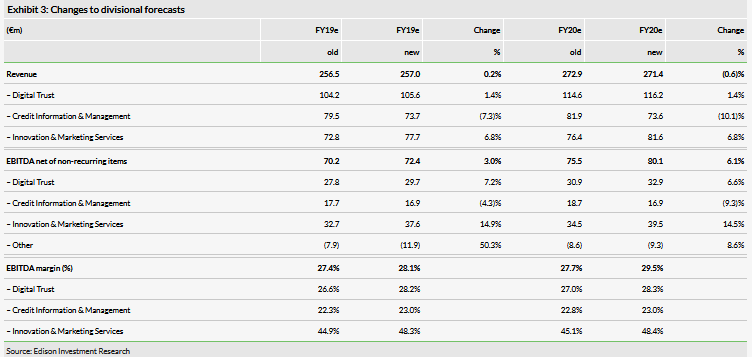
We have increased our forecast EBITDA for FY19 and FY20 by c 3% and 6%, respectively, based on higher revenue growth assumptions for Digital Trust and Innovation & Marketing Services, but lower assumptions for Credit Information & Management. In addition, we increase the assumptions for EBITDA margin in all three divisions. We update our forecasts for IFRS 16, which adds €3.2m to EBITDA in FY19 and FY20, although this is offset in FY19 by the incentive charge for virtual stock options of €3.3m. We remain above management’s reiterated guidance for FY19 of revenue above €250m and EBITDA (pre IFRS 16 and incentive charge) between €68m and €70m.
Valuation: Attractive again
In our view, buoyant margins, growth prospects for the two largest divisions, and the benefits of the group’s strategic re-organisational programme point to upside in the valuation. We increase our DCF-based valuation from €14.2 to €14.6 per share, which offers 17% potential upside to the current share price. The EV/EBITDA multiples for FY19 and FY20 are 10.0x and 9.0x, respectively.
Business description
Tinexta has three business divisions: Digital Trust – solutions to improve digital security; Credit Information & Management – information services to help manage corporate credit; and Innovation & Marketing Services – consulting services to help clients develop and/or grow their businesses
Q219: Revenue and profit growth moderated

Following strong Q119 results, group revenue growth moderated in Q219. Particular points to note from the H119 results were the strong performance in Digital Trust and Innovation & Marketing Services, and the accelerated decline in Credit Information & Management. Net of the ‘virtual stock option’ charge, group EBITDA for H119 would have expanded to €35.7m, a margin of 28.2%, from €29.2m in H118, a margin of 25.6%. Net debt increased to €140m, around 2x forecast FY19 EBITDA, almost entirely as a result of the adoption of IFRS 16, which added approximately €15m in lease-related debt.
Organic revenue growth in Q219 was 3.3% vs 10.2% in Q119 equating to 6.4% for the first half. Comparatives for Q219 were tougher than for Q119 by approximately four percentage points, ie moving from 3.1% in Q118 to 7.5% in Q218. The two largest and most profitable businesses, Digital Trust and Innovation & Marketing Services, continued to generate the highest revenue growth, with growth accelerating at the former. Credit Information & Management’s organic revenue declined at a faster rate than in Q119 due to competitive pressures and declining demand due to the macro environment in Italy.
Organic EBITDA growth slowed in Q219, in part due to some non-recurring costs in Digital Trust as well as the deterioration at Credit Information & Management. The charge for virtual stock options, which is not expected to recur to the same extent, tipped the company into an organic EBITDA decline. H1 group EBITDA net of non-recurring items was €33.4m, at a margin of 26.4% (which adjusts to 28.2% excluding the impact in this period of the virtual stock option plan). The corresponding H118 margin was 25.6%.
Management has reiterated guidance: FY19 revenue greater than €250m (€238.7m in FY18) and EBITDA before IFRS 16 of €68–70m (€66m in FY18). There remains no official guidance on the impact of IFRS 16, but H119 included a benefit of €1.7m to EBITDA, which is consistent with our estimate at the time of the Q1 results of €3–4m for a full year. Netting off this IFRS uplift will be the charge of c €3.3m for virtual stock options, recorded in the Other business unit ie corporate costs, which reflects the share price performance. The virtual stock option is a cash charge and does not require the issue of new shares or options.
Tinexta generated €23.7m of free cash flow (FCF) in H119, an increase of 5% vs H118, which reflects a higher EBITDA margin, slightly higher working capital outflow and lower capex/ sales. The FCF would have been €3.3m higher if the virtual stock option charge was not taken.
Looking forward, we note that the third quarter tends to be a seasonally less important quarter than the second and fourth quarters.
Digital Trust (40% of revenue, 36% of EBITDA)
After a typically lower growth first quarter, in which organic growth was 9.5%, growth accelerated to 10.5% in Q219, resulting in 10% growth in H119. In contrast, organic EBITDA growth slowed to 4.5% in Q219 from 10.1% in Q119 as the division incurred extra costs of c €400k for help desk support for smaller clients from the start of 2019, when electronic invoicing became mandatory for private businesses in Italy. As a result the EBITDA margin declined by c 80bp, but as these costs should not recur in H219, our assumption that the FY19 margin will increase is underpinned, in our view. Given the performance in H119, we have upgraded our forecasts for FY19, as described later.
After the end of the first half, the main subsidiary, InfoCert, signed a commercial partnership with Verimi to extend and strengthen the digital services offered by the platform in Germany. This is Tinexta’s first entry into the German market, and unlike previous moves outside of Italy, it has not required a capital investment. It is too early to provide detailed guidance on the opportunity but this is an important step as Germany should ultimately become the largest market in Europe for digital trust services, as management believes the relative market sizes for digital trust services should correspond to GDP in each country. Management currently expects the partnership will achieve a similar margin to that achieved in Italy despite leveraging Verimi’s distribution network.
Credit Information & Management (33% of revenue, 24% of EBITDA)
The weaker market conditions evident at the start of the year have intensified such that the organic revenue decline accelerated from 3.1% in Q119 to 10.2% in Q219. The real estate valuation business continued to experience ‘strong’ growth, which we interpret as 5–6%, in which case we estimate the core credit information business could have declined by a percentage in the mid-teens. In the latter, spend by corporate clients was relatively weak in Q119, but there was a good recovery towards the end of Q219, after the company invested in new product packages and direct marketing. Conversely, spend by the company’s financial clients was resilient in Q119, but weakened during Q219 given the macro environment in Italy. Management believes that it is not losing market share and the decline simply reflects market conditions. Looking forward, a recovery in spend by financial clients in H219 is not expected, but there is some optimism for moderating the overall rate of decline as the recovery in spend by corporate clients continues. The acquisitions made in 2018 (Comas, Webber and Promozioni Servizi) continue to trade well, adding 8.7% to the division’s revenue in H119. Given the slowdown in Q219, we have downgraded our long-term revenue growth assumptions, as detailed later.
Further good control of costs, while incurring extra costs to stimulate demand among corporate clients, limited the organic EBITDA decline to 2.5% in Q219, which produced a higher margin of 22.9% in Q219 vs 20% in Q218. This includes some dilution from the acquisitions, made in 2018, which had a lower EBITDA margin of 23.7% in H119.
Innovation & Marketing Services (28% of revenue, 40% of EBITDA)
After an exceptionally strong Q119, which saw organic revenue growth of c 33%, growth moderated to a still healthy 7.6% in Q219. Warrant Hub, the innovation consultancy, and specifically the subsidised finance consulting business, continues to drive this growth. There was little commentary on Co.Mark, the export consultancy business, which is in a year of restructuring as a result of a change in management, following a modest performance in FY18. We remain optimistic for the outlook of Warrant Hub given the Italian government approval of a new Growth Decree, effective on 29 June 2019, to stimulate economic growth, including the renewal of the super and hyper-amortisation measures aimed at helping business investment, which Warrant Hub advises on.
This business unit continues to exhibit high operational gearing, given the nature of the fees, and the relatively fixed cost base with an organic increase in EBITDA of 10.8% in Q219, to give an EBITDA margin of 52.6%, vs 39.1% in Q119. Year-to-date, c 74% of incremental organic revenue has dropped through as organic EBITDA. Given this performance, we have upgraded our medium-term forecasts, as described below.
Forecasts: Upgraded with improved quality of growth
For the first time, we adopt IFRS 16 in our forecasts, which adds €3.2m to our estimates of EBITDA net of non-recurring items. In addition, we include the charge for virtual stock options reported in H119 of €3.3m. The table below summarises our changes to forecasts. Our forecast for EBITDA in FY19 of €72.4m remains above management’s guidance of €68–70m, which is pre IFRS and the charge for virtual stock options. On a conference call accompanying the results, management confirmed that it is confident of beating its guidance.

The changes to our forecasts for the business units are discussed below.

Given the acceleration in growth reported in Q219 we increase our forecast for Digital Trust’s organic growth in FY20 to 10% from the 9% we assumed in our initiation in April. This is consistent with our medium-term assumptions of 10% organic growth, which may prove to be conservative if international growth, including the entry to Germany, which is not in our forecasts, accelerates. We continue to assume 30% of incremental revenue drops through to EBITDA.
We have significantly increased our forecasts for Innovation & Marketing Services. In our initiation note, we assumed medium-term organic revenue growth of 5% from FY20 with a gradual build from 3% in FY19. Given the strong performance year-to-date, and the recently enacted Growth Decree in Italy, we now assume 10% organic revenue growth in FY19, which implies organic growth of 4.6% in H219 vs 7.6% in Q219. Comparatives in H219 are much tougher, 3.5% in H118 and 35.8% in H218. We also increase our margin estimates and now assume 60% of organic revenue growth drops through to EBITDA in FY19 and 50% thereafter, which is conservative compared with the 74% noted above. These assumptions produce an EBITDA margin pre IFRS 16 of 48.1% in FY19 and 48.2% in FY20 vs our previous respective estimates of 44.9% and 45.1%.
We have reduced our forecasts for Credit Information & Management. We assumed that organic revenue growth for FY19–21 would be 3% pa with the higher than average growth of real estate, ie 4–5%, offset by lower growth in the core credit information business, ie 1–2%. We continue to assume 4–5% organic growth for real estate in FY19 and FY20. For the core credit information, we assume 8% organic decline in FY19, given some recovery in corporate clients and no recovery in financial clients, and 3% decline in FY20. In aggregate, these assumptions produce an organic decline of 5% in FY19 and no growth in FY20. Management remains confident of generating an EBITDA margin of 23–24% in FY19; we stick to the low end of the range, which implies an H219 margin of 20.7% vs 25.1% in H119.
In aggregate, these assumptions produce group organic revenue growth of c 5.5% and organic EBITDA growth of 6% in FY19–20.
Financials
Tinexta generated €23.7m of FCF during H119 vs €22.7m in H118. FCF generation relative to sales deteriorated a little, which reflects the higher EBITDA margin offset by a slight increase in the working capital outflow. As expected, the company has been actively buying in minority shareholdings, taking the holding in Warrant from 70% to c 90% during H119 for c €23m. Following the period end, Tinexta purchased the final 10% of Co. Mark and 40% of Visura, so that both are now fully controlled. In aggregate, the cost of these minority purchases was €20m.
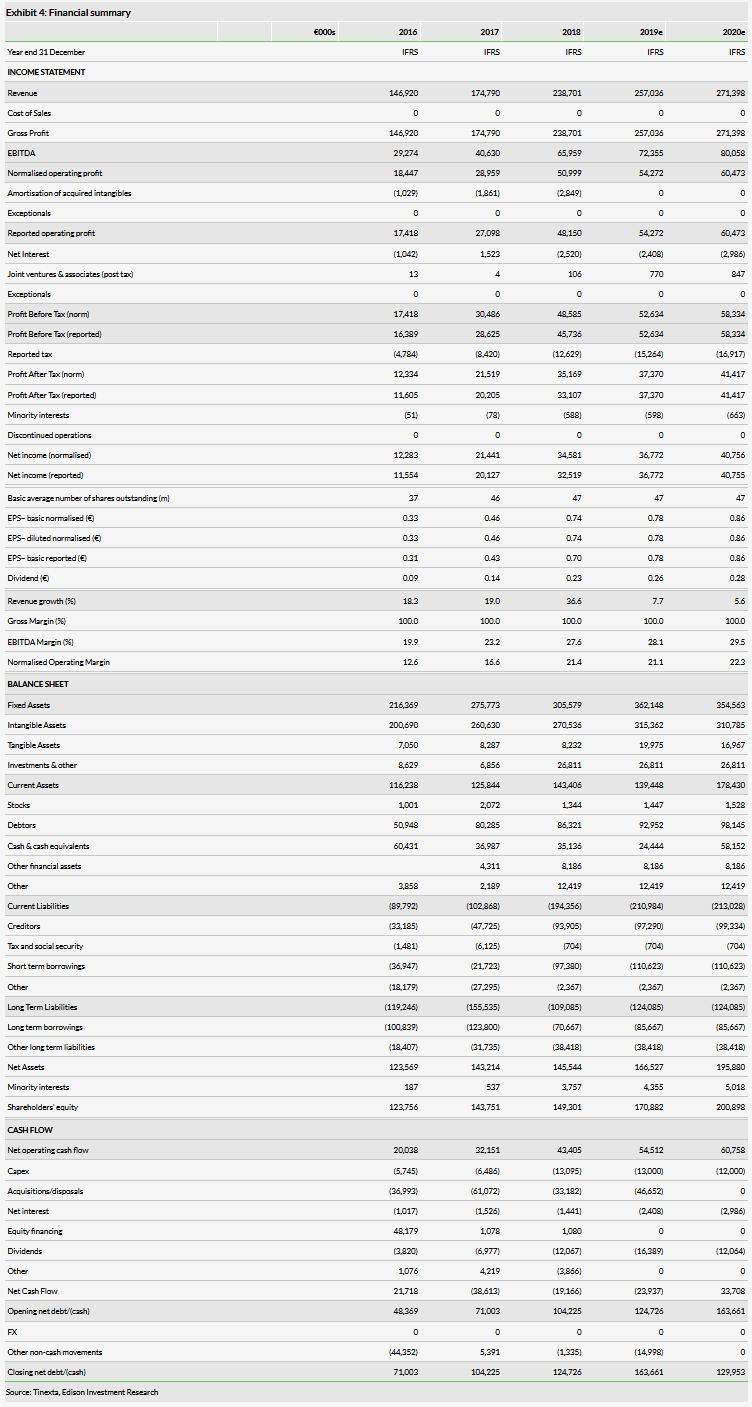
At 30 June, Tinexta had net debt of €140m vs €125m at the end of FY18. The adoption of IFRS 16 has added c €15m to net debt.
Valuation: Margins and growth undervalued
We have increased our DCF-based valuation by 3% to €14.6 per share from €14.2, which reflects the growth in EBITDA, the buyout of the minorities, and some roll forward of the model in time. The key assumptions beyond FY21 are a quick fade from 5–6% organic revenue growth to 3% in FY24 and annual increases in EBITDA margin from 29.6% in FY21 to 31.2% in FY30. We continue to use a WACC of 8.5% and terminal growth of 2%.

Tinexta’s EV/EBITDA multiples for FY19 and FY20 are 10.0x and 9.0x. Our forecasts now adopt IFRS 16, but as adoption by other companies and in analysts’ estimates will take time to feed through to consensus, peer group analysis comparison is not meaningful.