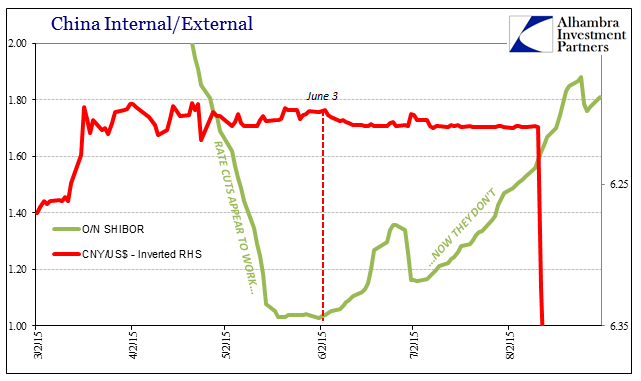
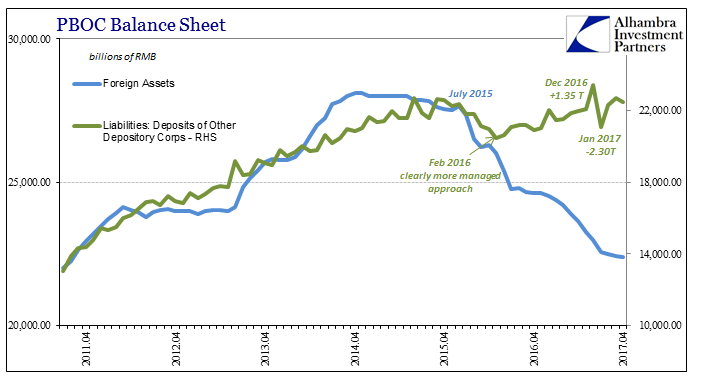
Chinese officials earlier this month broadcast they were ready to buy US Treasury bonds again. After selling an unknown quantity (there are different figures, none of which exactly agree) over the past few years, the announcement was clearly aimed at China’s exchange rate. Officials have taken to CNY stability as a central focus of official policy, to the detriment even of internal conditions.
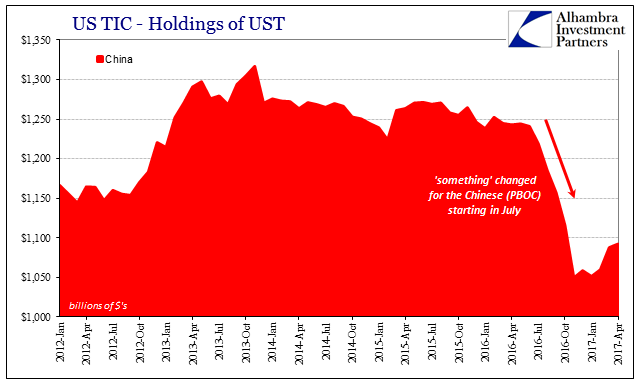
The US Treasury Department’s TIC data suggests that the Chinese at least officially have already been doing this. Though not by a huge amount, the reported custody holdings on behalf of China have gained in each of the last four months. The aggregate balance is once again nearly $1.1 trillion, just a little less now than what is estimated on account for the nation of Japan.
The financial system, as we well know, isn’t ever so simple. It has long been known that Belgium (and even the UK) has been holding Chinese collateral by proxy (likely in derivative trades of unknown quantities and type related to what is really US$ collateral). Unlike what is reported for the mainland of China, Belgian holdings have been falling during those same four months. That actually makes sense given that CNY has long past its “ticking clock” now, overrun by a full three months at this point which suggests some sort of ongoing but off-balance sheet effort (either direct PBOC or on behalf of it via Chinese banks).
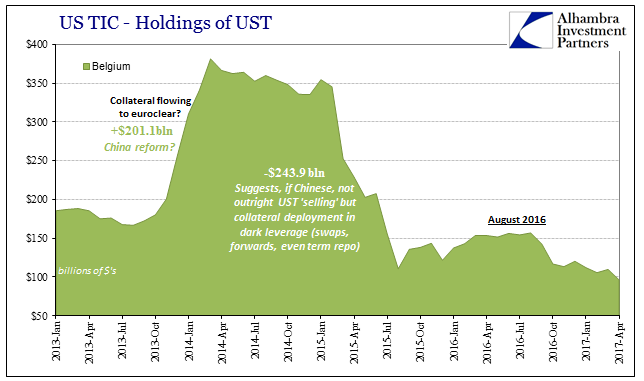
These estimates for Belgium actually fit quite well with other data and observations (subscription required):
If that was an organic trend, one fostered by a truly stable global “dollar” market, RMB markets wouldn’t be where they are. Nor would the PBOC need to resort to behind-the-scenes activities meant to hide instead “outflows” (though the word “hide” is in this context somewhat misleading; the PBOC is not so much hiding them as using non-traditional means to shape them in its favor).
Prioritizing a stable CNY means using these other methods that in the end tighten RMB markets often considerably. The relationship is easily established.
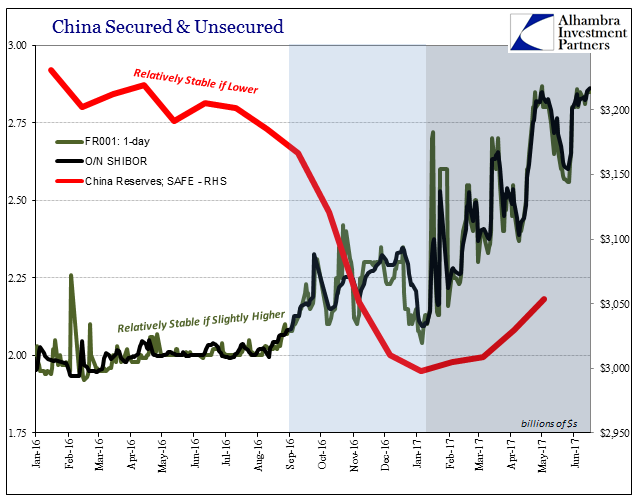
The overall trend in figures reported by China’s SAFE match what the Treasury Department is suggesting via TIC – minus, of course, the Belgium connection. Rather than having experienced “inflows” of “dollars” and buying UST’s with them, it is very likely instead that China is redistributing amongst its various capacities to make it appear that way.
They find instead four months of outflows which would be consistent with the present situation in China’s money markets. By focusing so much on CNY, the PBOC has made the choice to let RMB markets take the brunt of this monetary intrusion. It made sense from their official perspective given that the media is all-too-willing to disguise it as intentional policy, and therefore mask that it is (related) pressure in the first place.
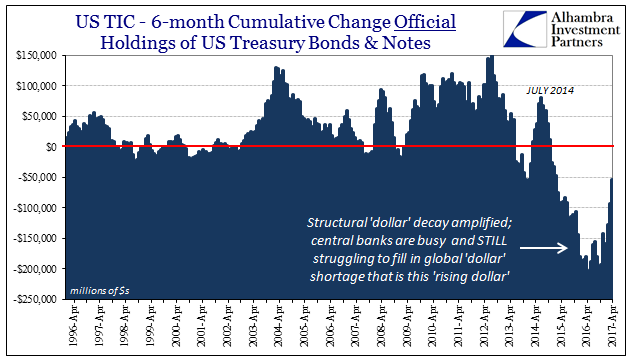
The problem, as always, is that the eurodollar erosion of the past few years did not disappear, it merely softened and only in relative fashion. There is still today “dollar” decay, as the foreign official sector continues to in the aggregate “sell UST’s” if not at the same pace as last year and the year before.
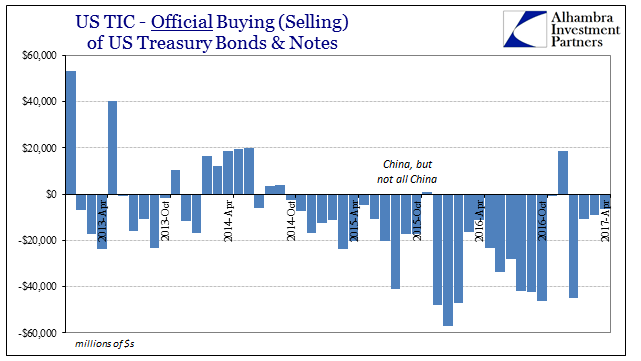
In April, the latest estimates, the level of “selling” was $6.6 billion, net. It’s a far cry from the almost regular $40+ billion levels that frequently occurred going back to 2015, but it is also at the same time nothing like past periods of “dollar” growth or even partial restoration (as in 2010-11).
Instead, we are left to wonder just how global bank balance sheets are drifting so far in Q2 2017. The TIC data on bank liabilities is, as is always the case, inconclusive with but a single month of what is a quarterly pattern. Up until last quarter, Q1 2017, banks had unevenly throughout each one only drawn down “dollar” liabilities going back to 2014. It had become common for the first month of every quarter to see a large increase, if only to partially offset the end month withdrawal for the previous three-month period.
For April 2017, the TIC data shows an increase of just $51 billion, less than half of January’s +$113 billion.
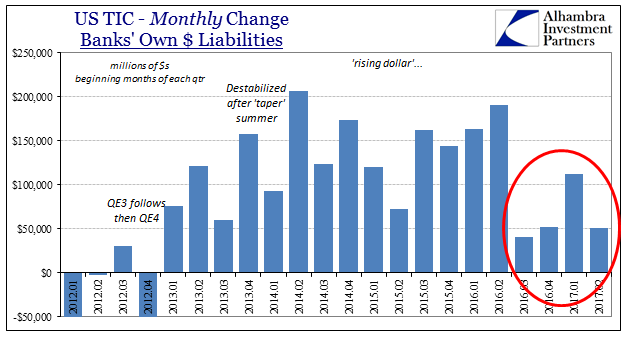
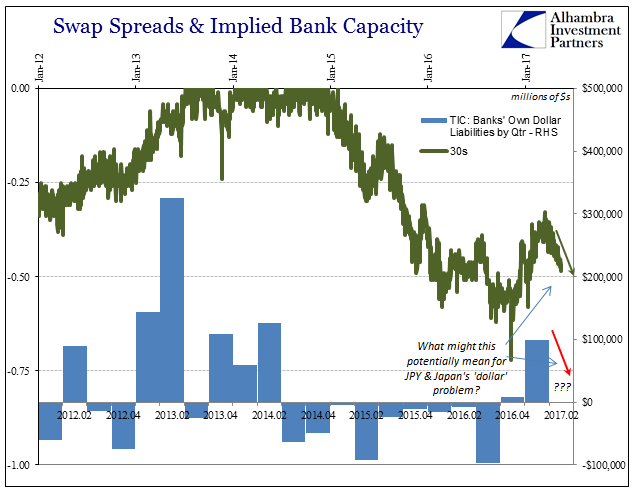
With just that partial information, it does appear to fit the anti-“reflation” sentiment and “dollar” indications gathered up to this point in Q2. Taken together, the withdrawal in March and rebuild in April, a net of +$11.3 billion (+$50.9 billion April, -$39.6 billion March) is much less than December-January (+$58.7 billion) but also considerably better than either September-October 2016 (-$65.0 billion) or June-July 2016 (-$129.7 billion). It would seem to be consistent with what is more like middle ground of late, well away from the highest level of “reflation” earlier this year but also not quite yet back into full-blown “dollar” disruption again (with further indications, however inconclusive, of at least moving in that direction).
That includes, as always, Japan’s central role in “dollar” redistribution and therefore JPY's important place in indicating the overall direction one way or the other.
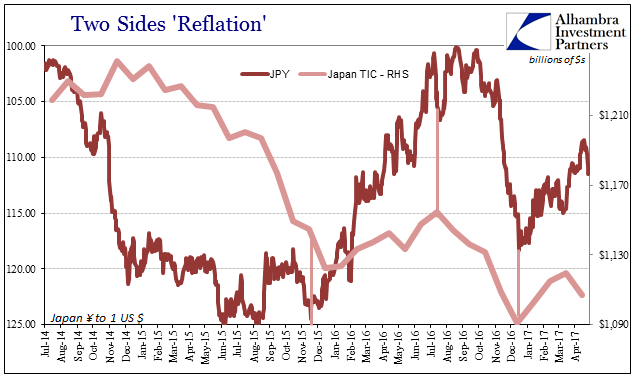
In terms of TIC figures, the slight withdrawal in April was in keeping with the shift in JPY back toward “devaluation” at the end of that month. From April 18 until May 9, JPY retraced nearly to 115 again. By the end of May, it was back in anti-“reflation” with mostly everything else, ascending toward 110.
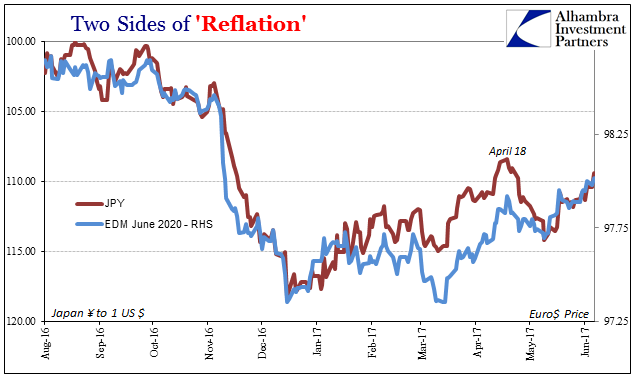
In a lot of ways, I have to believe all three of these factors are related: China hiding “outflows”, Japan reversing redistributions, and banks caught between renewed “dollar” devastation and what would be more toward normalcy (at least as before the “rising dollar” sense of it). In fact, it would be quite reasonable that if the banking interpretation is correct that is the reason for the PBOC being able to hold CNY this long. The problem with that is if global “dollar” conditions keep going in the wrong direction again – just like they did in 2015 during “transitory” oil.
