As the coronavirus pandemic rages on, governments are taking measures to restrict unnecessary travel and mass gatherings. The airlines sector is probably the one being hit the hardest by the restrictions. The high fixed costs and huge debt loads of the airlines make them extremely vulnerable to economic downturns. With international and domestic travel on the verge of grinding to a halt, bankruptcies seem a real possibility.
As a result of this dire situation, airline stocks plunged sharply across the board, losing 30-70% YTD. And while prospects for the industry appear bleak at best now, there was a time when airline stocks looked very attractive.
Avoiding Buffett’s Airline Nightmare
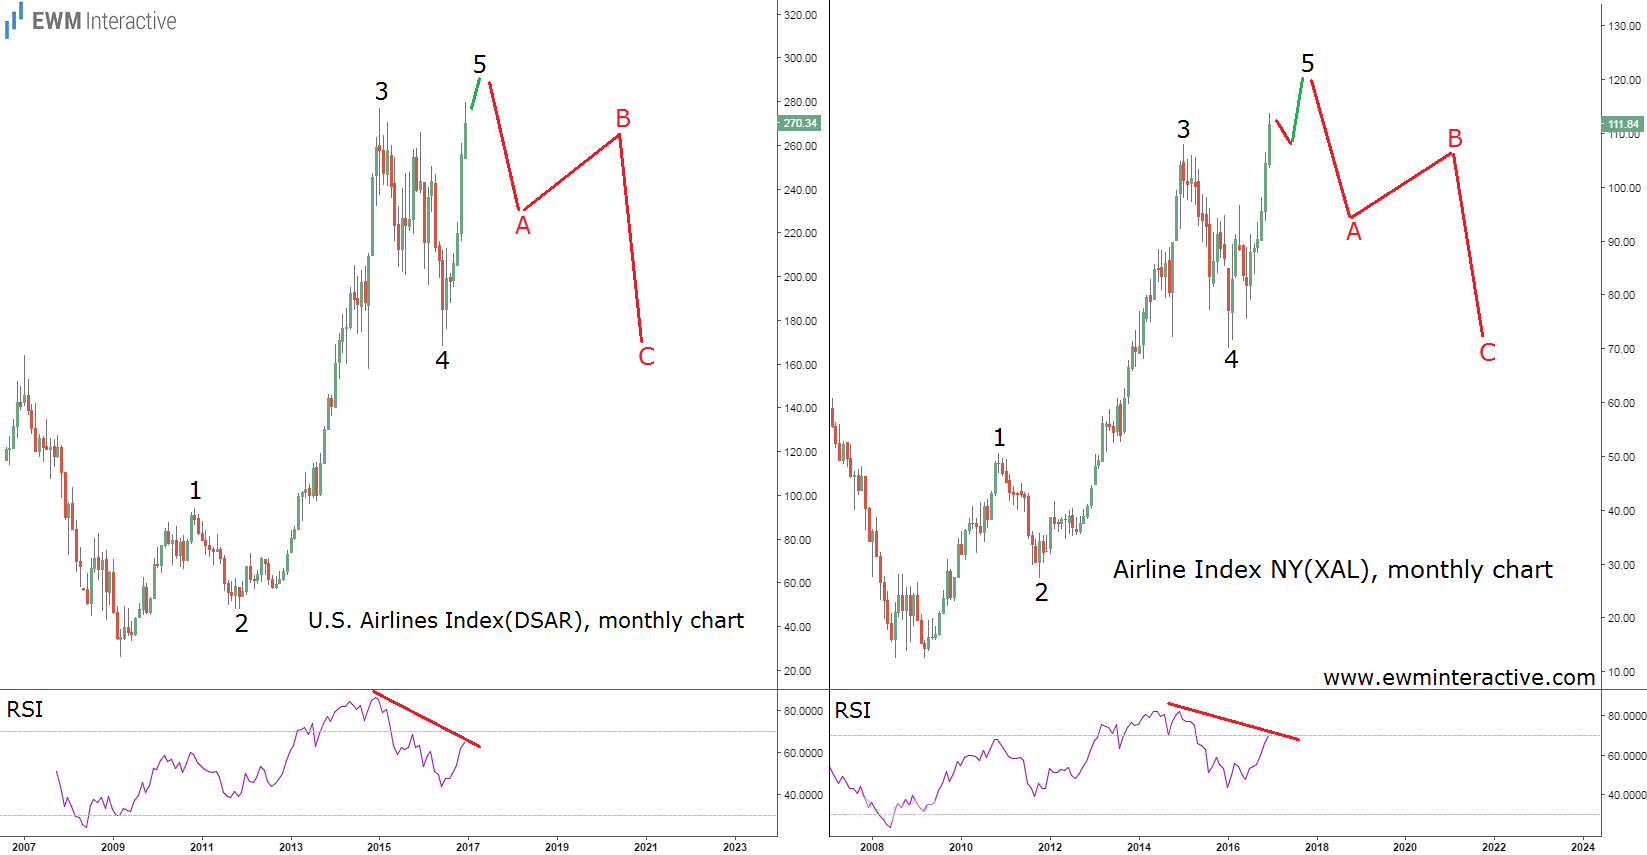
Over three years ago, Warren Buffett disclosed a significant stake in the four US airline majors. Shortly after, in mid-December 2016, we published the following charts of two airline indices in an article titled “Mere Mortals Should Leave Airlines to Buffett.”

The US Airline Index (DSAR) and the Airline Index NY (XAL) had been rising in the years after the Financial crisis. The structure of that recovery, however, looked like an almost complete five-wave impulse. According to the Elliott Wave principle, a three-wave correction follows every impulse.
This simple rule led us to conclude that “once the fifth waves in both indices end, a significant decline to the support area of wave 4 should follow.” In addition, both charts revealed a strong bearish RSI divergence between waves 3 and 5. So instead of joining probably the greatest investor of all time, we decided to observe from a safe distance. Now, three years and one coronavirus pandemic later, take a look at the updated charts below.

DSAR, now named DJUSAR, and XAL reached their peaks in January 2018 at 313.5 and 124.4, respectively. As of this writing, the two airline indices are down by 52% and 59% from their respective wave 5 tops. The A-B-C zigzag corrections dragged their indices much lower than the support of wave 4.
Is Wall Street Wrong Again about the Airlines?
Obviously no-one could’ve known that a global coronavirus outbreak is going to rattle the airline sector in 2020. But the almighty market, through the Elliott Wave patterns it forms, somehow sensed the tough times ahead over three years in advance.
Airlines looked like a great investment until January 2018, but in reality they were not. Now, they look like a terrible investment, but are they? The recent plunge served its purpose and completed the 5-3 wave cycle from the low in March 2009. This means the larger trend can now be expected to resume in the direction of the impulse pattern.
The habit of the market is to anticipate, not to follow. Even if things do get worse from here and some airline companies turn belly-up, the situation for the sector is eventually going to improve. At least that is what the charts of the two airline indices are telling us right now. Let’s see what happens…
