It’s everyone’s dream—a double-digit yield. And what’s dreamier than a 13.6% payout?
That’s exactly what the little-known, small fund I’m going to show you today promises.
And you should run away fast.
Before I explain why, let me tell you what this fund does and how it works.
I’m talking about the Stone Harbor Emerging Markets Income Fund (EDF (PA:EDF)), a tiny fund focusing on developing countries that has just $229.4 million in assets under management.
For the last 8 years, the fund’s managers have been doing their best to make it grow (and keep its juicy 13.6% payout coming) by choosing the best stocks, bonds, foreign currencies and other assets in emerging markets. A quick glance at a chart makes it look like EDF is doing pretty well:
A Deceiving Chart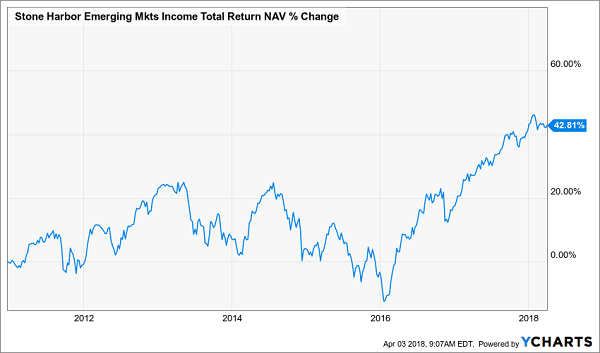
But keep in mind that this is a return over 7 years, which means EDF’s average annual return has been a paltry 4.9% including dividends. The much less volatile, and safer, SPDR S&P 500 ETF (NYSE:SPY) has absolutely crushed this fund over that period.
A Big Laggard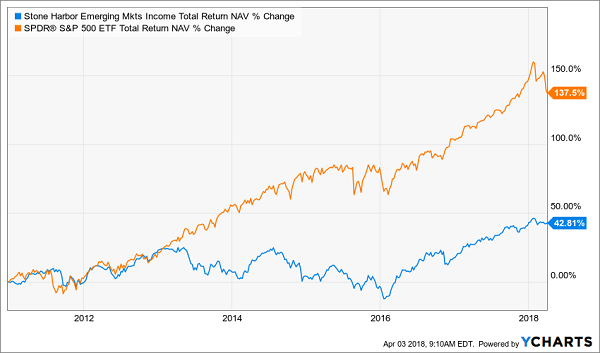
Investors are overlooking that fact for a couple of reasons. For one, EDF’s gains have all come in the last 2 years, which has led some folks to think the fund’s worst days are behind it. But a fund that was flat or down for half a decade should give you pause!
More Reasons to Pause
And that’s not the only problem.
Right now, EDF is costing investors a massive 2.2% management fee—and that number is climbing for one reason: leverage costs.
To boost returns, EDF borrows money at a rate tied to the 3-month US-dollar LIBOR, an interest rate benchmark a lot of companies and leveraged funds use to goose returns.
But there’s just one problem—and it’s this chart.
Borrowing Costs Exploding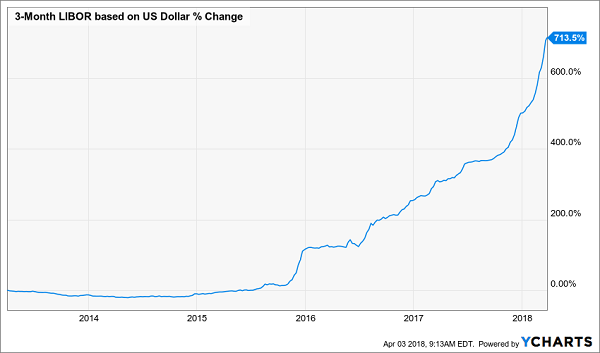
The Federal Reserve has already raised rates a few times since 2015, when you see the blue line above start to climb. And the Fed is planning more aggressive hikes—at least 3 more in 2018, as expected by most on Wall Street—which is going to cause the LIBOR to go higher. The higher this goes, the more expensive it is for EDF to borrow money.
That, in turn, will drag down returns. We’re already seeing it happen.
LIBOR Dragging Down EDF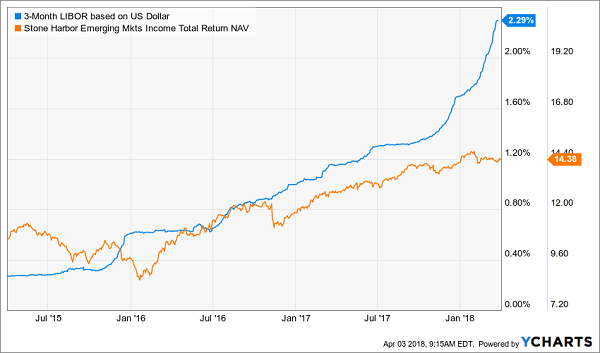
At the start of the interest rate hikes, EDF was doing fine, and it looks like the two were going in lockstep with each other. There reason: while the LIBOR was rising, the US dollar was falling, causing the foreign currency–denominated assets in EDF to appreciate in US-dollar terms.
But the impact of a lower dollar has pretty much already been priced into the emerging market universe, limiting returns—which is why the orange line leveled off in late 2017, even as the blue line skyrocketed.
This means EDF will struggle to keep earning significant profits to return to shareholders—and this isn’t even the scariest part.
The Dangerous Dividend
Remember that 13.6% dividend? Sad to say, but it’s totally unsustainable.
There are two big reasons for this. The first has to do with diminishing returns from emerging market investments in recent months.
Big Gains Slowing Down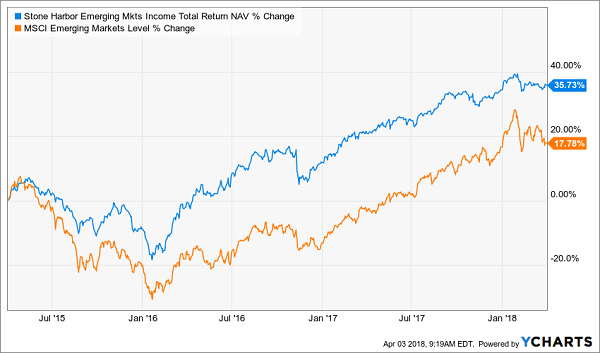
As you can see by comparing the MSCI Emerging Markets Index (which measures the value of a variety of assets in emerging markets around the world), the big gains of 2016 and 2017 are slowing down—as is EDF. And since EDF’s gains are a bit over double the index’s return, it seems that the gains in the emerging market universe are largely priced in.
That is going to make it tougher for EDF to get the emerging market income and capital gains it needs to sustain its massive dividend.
And there’s one more chink in the armor that makes things even worse for EDF!
You see, EDF is a closed-end fund (CEF), which means there are a fixed number of shares (more or less) that trade on the market relative to how much the fund’s assets are really worth. This creates a disconnect between EDF’s market price (what you see on the stock exchanges) and its net asset value (NAV), or the amount of cash EDF would get if it sold all of its assets immediately.
With a lot of CEFs, the market price can trail the NAV for months, even years, creating a discount to NAV that opportunistic investors can jump on. EDF is an odd duck, trading at a massive 10.4% premium to NAV that’s far above its average 0.5% premium over the last 7 years.
Don’t Overpay!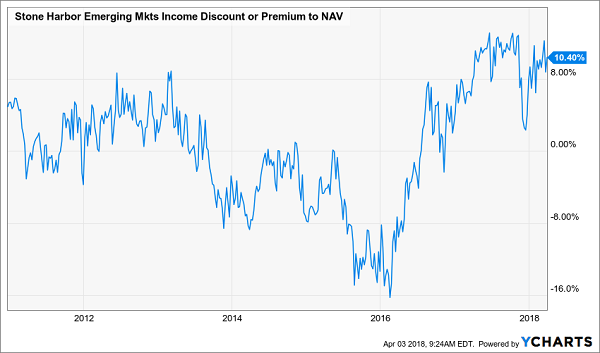
The real danger here isn’t only that the market will realize it’s bid up these assets too high; it’s that this premium to NAV also makes it harder for EDF to sustain its dividend.
Because of that premium, while EDF is paying a 13.6% dividend on its market price, it actually needs to earn a 15.2% return in the market to sustain that dividend on its NAV. That’s almost as much as the 17.8% return in the MSCI Emerging Markets Index over the last 3 years!
That means EDF’s dividend will get cut soon. And when it does, the market will be shocked—causing the fund’s price to crash alongside the dividend cut.
The reason for this is that EDF has never cut its dividend, which, means the market has already taken for granted that the fund’s payout will always be as high as it is. When they realize their mistake, investors will bail—and fast!
If you don’t believe me, look at what happened to the PIMCO High Income Fund (NYSE:PHK), another CEF that kept its dividend constant for over a decade until a shock cut in 2015.
Dividend Falls—and Takes the Market Price With It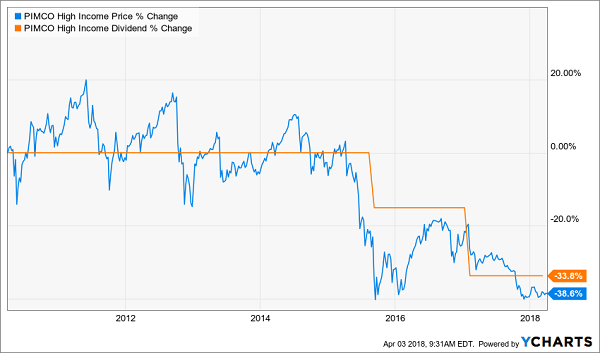
EDF is the next PHK—a disaster that income investors need to run away from.
SAFE 7.6% Yields and Double-Digit Gains—Here’s How We’ll Do It.
But there are many reasons to buy 4 other CEFs I urgently recommend you snap up now.
Let’s start with the discount: unlike EDF, these 4 under-the-radar funds trade at massive (and unusual) markdowns to NAV.
That makes their payouts, which run up to 8.1%, SAFE. Plus, when these weird markdowns snap back to “normal,” these 4 funds’ share prices will catapult higher too!
How high?
We’re “pre-loaded” for easy 20% price gains here, and when you tack on the 7.6% average CASH dividends these funds throw off, we’re talking about a 28% total return in the next 12 months.
And remember, that’s just the average—some of these 4 superstar funds are primed to soar even higher!
I’ve put all the details—fund names, tickers, buy prices and more—in an exclusive FREE report called “4 Great CEFs to Buy Now: 7.5% Yields and 20% Upside Ahead.” Click here and I’ll reveal my entire CEF investing strategy and give you your own copy of this breakthrough report right now!
Disclosure: Brett Owens and Michael Foster are contrarian income investors who look for undervalued stocks/funds across the U.S. markets. Click here to learn how to profit from their strategies in the latest report, "7 Great Dividend Growth Stocks for a Secure Retirement."
