It’s not even November yet, but the holiday season is already upon us – at least in the world of advertising. Much to my dismay, Christmas shopping commercials are already out in force.
For investors, that means the yearly dash to buy retail stocks before first-quarter earnings in January is also upon us.
Interestingly, this popular trend does have some merit.
Since 2010, the SPDR S&P Retail (N:XRT), an exchange-traded fund that tracks S&P 500 retail stocks, has outperformed the S&P 500 by more than 100% during the fourth quarter.
But this year, many investors are wondering whether they can still find alpha with Amazon.com Inc (O:AMZN) terrorizing the retail sector.
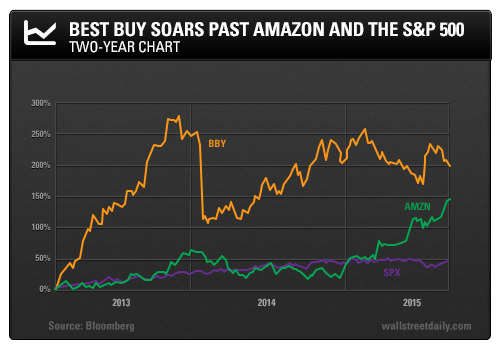
Over the past decade, Amazon shares have beaten the market by more than 1,300%, and the company has crushed its brick-and-mortar competitors along the way.
However, it’s not the stock investors should be targeting as the holidays approach.
You see, I’ve found this year’s most compelling retail investing opportunity – and the time to buy is now.
Back in Black
Best Buy Co (N:BBY) is one of America’s largest providers of tech products, services, and solutions. The company operates over 1,700 stores internationally and records 1.5 billion transactions per year.
But after hitting an all-time high in 2005, Best Buy shares declined sharply. Like rivals Target Corp. (N:TGT) and Wal-Mart Stores Inc. (N:WMT), Best Buy’s physical stores became “showrooms” for Amazon shoppers. Armed with smartphones, customers would regularly check out merchandise in person before buying the same items online.
Then, after an abysmal fiscal year in 2011, Best Buy underwent a massive reorganization.
In 2012, the company shook up management, closed 50 stores, and aggressively cut costs. Best Buy even took on Amazon with aggressive price-matching – at the expense of profit margins.
These efforts paid off in a big way. To date, total operating expenses are down over 50% and net income is up over 200%. But don’t take my word for it. Let’s go to the charts.
The Charts Don’t Lie
Best Buy shares have rallied 206% from a 10-year low in 2012, besting both Amazon and the S&P by a wide margin.

For its part, Amazon is currently valued at a whopping 882 times earnings. The company’s forward P/E isn’t much prettier at 128x.
Best Buy, on the other hand, is valued at a deep discount to both the industry and the S&P 500 at just 12.3 times earnings.
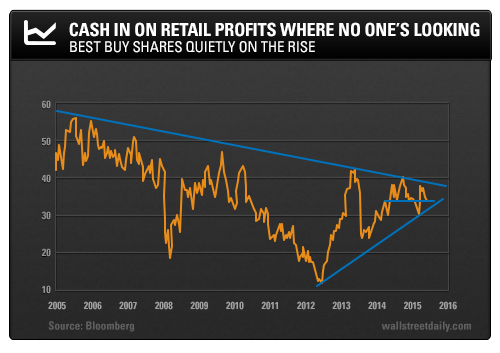
A wide-view look at Best Buy’s chart below reveals that, while shares have trended down, support for shares has risen faster than long-term resistance. In other words, we could see an extreme breakout to the upside by mid-2016.What I really love about Best Buy is that 89% of its profits come from the United States, which insulates the company from international growth declines and currency effects.

At the moment, Best Buy shares are under pressure from a strong Amazon earnings report, but I expect a speedy recovery as shares test support around $34.28.
That means now is the time to buy the dip ahead of the holiday rush.
Bottom line: While the rest of the investing world overpays for Amazon shares, you can quietly ride Best Buy’s shares to retail profits.
On the hunt,
