The advance estimate released today by the Bureau of Economic Analysis showed U.S. real GDP growth falling to an annual rate of just 0.1 percent in the first quarter of 2014. If confirmed by later revisions, that would be weakest quarterly growth since the end of 2012.
The slowdown was remarkably widespread. The contribution to real growth from consumer spending, which was 2.22 percentage points in Q4, slowed to 2.04 percentage points in Q1—and that was the good news. The contribution of investment spending flipped from a positive 0.41 percentage points to negative -1.01 points, with fixed investment, inventory investment, and residential investment all in the minus column. The contribution to growth of exports, which have been an element of strength throughout the recovery, dropped from +1.23 percentage points to -1.07 points, only partly offset by a small decrease in imports. Finally, the contribution to growth of state and local government expenditures, which, for the first time in the recovery, had been positive in the final three quarters of 2013, turned negative again. A tiny 0.05 percent boost from federal government spending was not enough to offset the negative growth at lower levels of government.
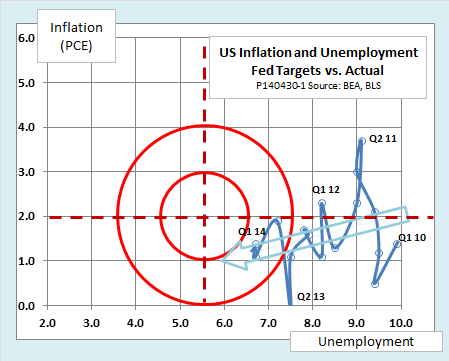
Today’s data release also includes the first estimate for personal consumption expenditure (PCE) inflation for Q1. The PCE inflation index and the unemployment rate are the Fed’s two main policy targets under its dual mandate to promote price stability and full employment. Currently, the Fed defines price stability as inflation of 2 percent for the PCE index and full employment as a range of 5.25 to 5.75 percent for unemployment rate.
Missed Goals
The following chart, which puts those target values in the crosshairs, shows just how badly the Fed is missing its goals. Since unemployment peaked at 10 percent in late 2009, the labor market has improved by fits and starts. It is gradually moving toward the upper limit of the Fed’s target range, as measured by the standard unemployment rate, although other indicators, like long-term unemployment, remain far higher than normal. Meanwhile, however, inflation has been tracking downward. As a result, the large arrow in the chart, which is fitted to a four-year linear trend of unemployment and PCE inflation, is on track to pass well below the center of the target.

But wait, you might say, isn’t low inflation good? If the economy can reach 5.5 percent unemployment while keeping inflation even lower than 2 percent, shouldn’t we celebrate? For two reasons, maybe not.
First, as market monetarists point out, the best guarantee of full employment and price stability over the long run is steady growth of nominal GDP in the range of 4 to 5 percent per year. In quarters like Q1 2014, when real growth slows, inflation should be running higher than normal, not lower than normal. The combination of slow growth and low inflation together are a sign that monetary and fiscal policy together are not providing enough oxygen to sustain the recovery.
Second, low inflation increases the risk of deflation if the economy encounters external shocks. That is true whether those shocks come from bad weather, from political risks like the conflict in Ukraine, or from some foreign economic crisis like a possible financial meltdown in China. So far, indicators like the Atlanta Fed’s deflation probability index remain in safe territory, but 1.4 percent is not much of a margin of safety.
It is not yet time to panic. Jobs data for the first quarter were not as strong as some had hoped, but not alarmingly weak, either. Maybe it was only the snow. We should also remember that the advance estimate for GDP is subject to substantial revisions, averaging plus or minus 0.7 percentage points. We will get better data over the coming months, and maybe they will show less of a slowdown. Still, as our chart shows, today’s numbers fit a four-year trend that is not completely reassuring.
