Highlights
- Market Movers: Weekly Technical Outlook
- USD/JPY flounders under a dovish Fed
- Look Ahead: Stocks
- Look Ahead: Commodities
- Global Data Highlights
Market Movers: Weekly Technical Outlook
Technical Developments to Watch:
- EUR/USD testing major resistance at 1.1450
- GBP/USD traders eyeing 1.5675 Fibonacci resistance
- USD/JPY remains rangebound between 118.50 and 121.50
- EUR/CAD in play, traders may look to fade dips toward 1.4750

* Bias determined by the relationship between price and various EMAs. The following system determines bias (numbers represent how many EMAs the price closed the week above): 0 = Strongly Bearish, 1 = Slightly Bearish, 2 = Neutral, 3 = Slightly Bullish, 4 = Strongly Bullish.
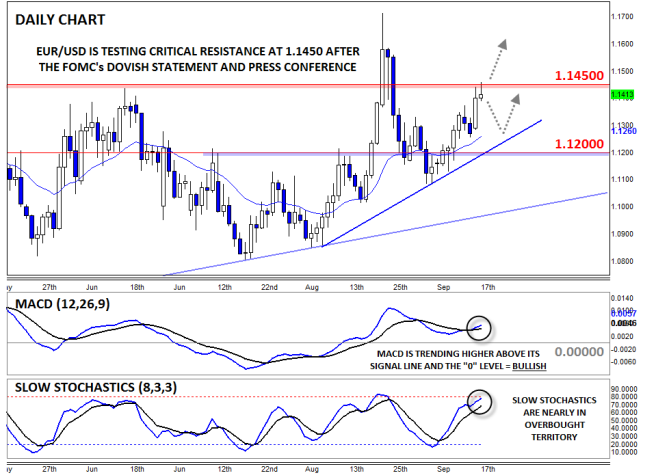
EUR/USD

- EUR/USD rallied strongly last week, boosted by the dovish FOMC statement and presser
- MACD has turned back to positive territory, but Slow Stochastics nearly overbought
- Key resistance looms at 1.1450
EUR/USD traded consistently higher last week, boosted by Thursday’s dovish FOMC statement and press conference. Since bottoming below 1.0500 earlier this year, the pair has quietly put in a series of higher lows and that medium-term uptrend has seemingly accelerated over the last two months. That said, the Slow Stochastics are nearly overbought as the unit tests critical resistance at 1.1450, so bulls may want to ensure prices can clear this barrier before turning their eyes further skyward.
Source: FOREX.com
GBP/USD

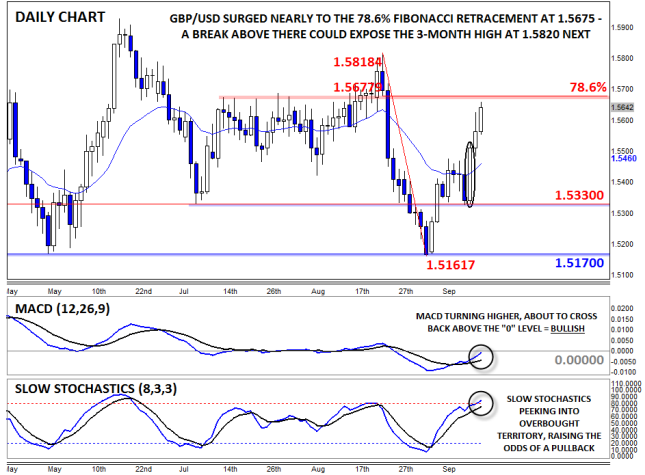
- GBP/USD rocketed higher off 1.5330 support last week
- MACD bullish, but Slow Stochastics now overbought
- A break above 1.5375 resistance could expose the 3-month high at 1.5820
GBP/USD surged after finding support at 1.5330 last week, forming a large Bullish Marubozu candle* on Wednesday and rallying into the close of the week (as of writing on Friday afternoon). Not surprisingly, the MACD is showing strongly bullish momentum, though the Slow Stochastics are peeking into overbought territory. For this week, bulls will want to see a break above 78.6% Fibonacci retracement resistance at 1.5675 to open the door for a potential continuation up to the 3-month high at 1.5820 next.
* A Marubozu candle is formed when prices open very near to one extreme of the candle and close very near the other extreme. Marubozu candles represent strong momentum in a given direction.
Source: FOREX.com
USD/JPY

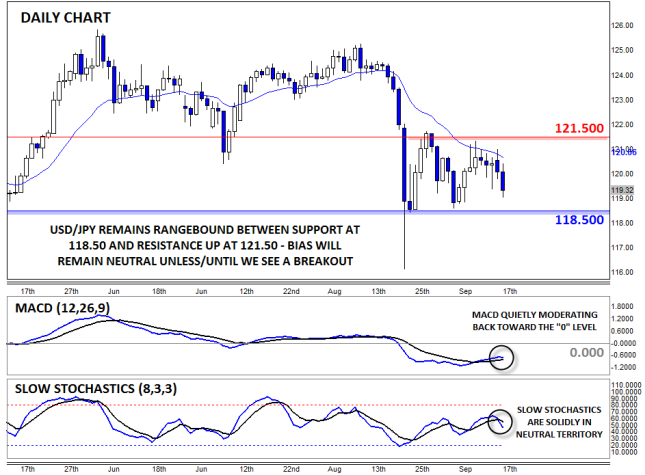
- USD/JPY dripped lower in quiet trade last week
- MACD and Slow Stochastics moderating back toward neutral levels
- Traders continue to monitor the current 118.50-121.50 range for a potential breakout
USD/JPY dripped lower in surprisingly quiet trade last week, and not even the highly-anticipated FOMC meeting could awaken the pair from its stupor. Now, both the MACD and Slow Stochastics are moderating back to neutral levels as the unit continues to consolidate in the 118.50-121.50 range. Unless and until we see a breakout from that one-month range, traders will maintain a neutral short-term outlook on USD/JPY.
Source: FOREX.com
EUR/CAD

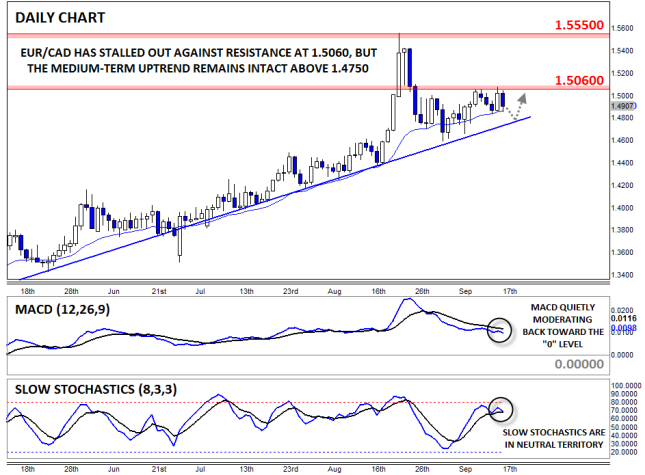
- EUR/CAD was stalled out against 1.5060 resistance last week
- MACD continues to show waning bullish momentum
- Longer-term uptrend remains intact above trend line support at 1.4750
EUR/CAD is our currency pair in play this week due to a number of high-impact economic reports out of Europe and Canada this week (see the “Global Data Highlights” section below for more). The pair pulled back from resistance at 1.5060 last week, but remains within a healthy medium-term uptrend. The MACD indicates moderating bullish momentum, but traders may still look to fade any near-term dips toward bullish trend line support at 1.4750 this week.
Source: FOREX.com
USD/JPY flounders under a dovish Fed
At its highly anticipated September meeting, the Federal Reserve chose to remain on the sidelines in light of a deteriorating global economy and soft inflation domestically, which is overshadowing evidence of a broad US economic recovery. The bank left the target range for the federal funds rate at 0-0.25% by a vote of 9-1. The lone dissenter, Lacker, voted to raise the target rate by 25 basis points, which is in complete contrast to one unknown Fed member who placed a dot below the zero line, hinting at the unlikely possibility of negative interest rates.
Overall, most policy makers still expect the Fed to raise interest rates by 25 basis points this year, although the number who anticipate a rate hike this year has recently shrunk. Three policy makers now expect the Fed to remain on hold until next year. The bank warned that recent developments in global markets are holding back the US economy and weighing on inflation.
It has been a tumultuous time for the global economy, which has been shaken by extremely volatile markets attempting to reassess the longevity and stability of key global economic powerhouses, namely China. The world’s second largest economy has been struggling due to a lack of global demand and domestic economic activity, as well as a massive sell-off in its equity markets. Not only has this cast doubt over the health of a key global economy, it has also reinvigorated US dollar bulls. While the direct exposure of the US economy to its exporters isn’t overly significant, the interconnected nature of the economy is passing on the deflationary effects of a stronger US dollar.
The wash-up
The US dollar sunk on the back of last week’s dovish policy meeting and accompanying press conference from Chair Yellen as traders pushed out expectations for policy tightening, with the market now split over whether the bank will raise rates at all this year. However, the reaction was less emphatic in equity markets which were only momentarily bolstered by the dovish tone of the Fed. Risk-off sentiment is still punishing global financial markets due to the aforementioned concerns about China’s economy, which is casting doubt over the global inflation outlook.
USD/JPY: knee-jerk reaction?
Nonetheless, the safe haven yen is still well above its pre-FOMC position, with USD/JPY dropping below 120.00 following the Fed’s policy meeting. However, the yen may not make the most of the gains in the near term given the increased prospect of further easing from the BoJ. Even though the expected policy prospects of the US and Japan have tightened recently, with the Fed delaying raising interest rates and the BoJ refusing to bow to market pressure for further easing, the long-term divergence of yields between the two nations should keep USD/JPY bears at bay. Key to this theory will be the release of consumer price numbers later this week, with core consumer prices expected to fall back into deflationary territory. Clearly, the current pact of easing in Japan isn’t enough, despite what some members of the BoJ apparently believe, and case for further stimulus (which is the BoJ’s only real option) is increasing day-by-day, proving fuel for yen bears.
Look Ahead: Stocks
The movements of stock prices in the days prior to the Fed’s rate decision on Thursday appeared to be the typical “buy the rumor, sell the news” sort of behavior. But when the news hit the wires, traders initially hesitated to push the ‘sell’ button because there was an element of surprise in the FOMC statement that was probably not priced in. Not only did one FOMC member vote to cut rates into the negative, but the dot plot showed that the median policy maker now expects core inflation to remain below the bank’s 2% target until 2018 and the long-term unemployment rate was revised down to 4.9%, suggesting there is less urgency to hike interest rates. So, to account for this surprise, they waited a bit longer before ‘dumping’ stocks.
The markets’ not-so-bullish response to the seemingly dovish message also suggests that investors probably are growing tired of the Fed’s waiting game and can no longer justify buying stocks at these still-elevated levels due to minor changes in the outlook for interest rates. What the markets really need right now is for economic growth to really pick up momentum and not only in the US but also in China, Europe and elsewhere. As there is little or no sign of this happening, we are still wary of the recent rebound in global stocks and think we could be in the process of a slow grind lower for at least a good few months. That being said though, a sustained move lower for the dollar as a result of a dovish Fed or otherwise should be good news for US exports and therefore earnings, while energy stocks and miners could start to outperform as some buck-denominated commodities recover their poise.
But following the breakdown of long-term bullish trends in August on the major indices, and the corresponding sell-off, the markets have bounced back as the sellers took profit and opportunistic bulls did some bargain hunting. But now that we’ve had a decent pullback, is it time for stocks to head lower once more?
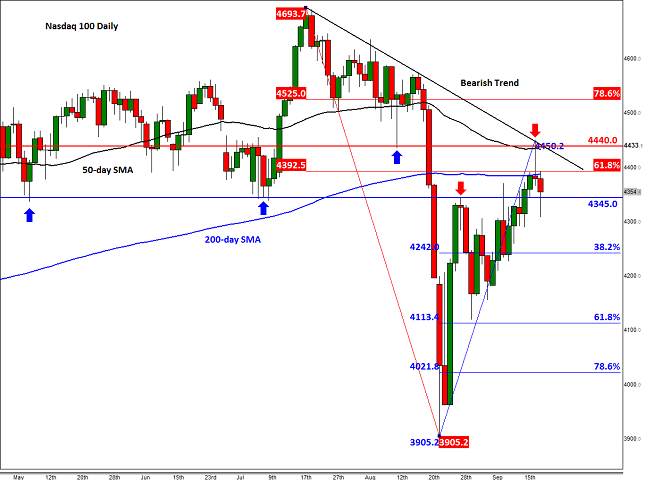
Among the major US indices, the Nasdaq 100 looks the most technically friendly – in fact, almost textbook perfect. If it were to resume its downward trend, it would do so from around these levels. As can be seen from the daily chart, the index ran into a wall of resistance around 4440 following an initial rally on the back of the FOMC decision on Thursday. Here, a bearish trend line, the 50-day moving average and previous support all acted as stiff resistance, leading to a sharp retreat. The U-turn helped to create a doji-like candle on the daily chart, which points to indecision and correctly indicated the follow-up selling on Friday from around those technically important levels. What’s more, the body of Thursday’s candle held below the 200-day moving average: another bearish outcome.
Although as we went to press the US indices had bounced off their lows, they were not out of the woods. A lot now hinges on 4345, a level which was formerly support and also resistance. Should the Nasdaq close below here, then a sharp move lower could be seen early next week, as after all there are not much further short-term supports seen until the 38.2% Fibonacci retracement level at 4242. But the potential sell-off could go a lot further over time.
This bearish setup would become invalid however on a potential rally and closing break above the trend line. If seen, the Nasdaq may then stage a rally to at least the 78.6% Fibonacci level at 4525, before possibly heading towards the prior high of 4694 next.
Source: FOREX.com. Please note this product is not available to US traders.
At the time of this writing on Friday afternoon, gold looks set to snap a three-week losing streak. The precious metal has found support from various sources this week, most notably from a weaker US dollar and renewed selling pressure of the equity markets. The dollar fell sharply on Thursday after the Federal Reserve disappointed those who were looking for a rate increase, and delivered a dovish policy statement. This helped to boost the EUR/USD, which in turn weighed heavily on European shares, most notably the German DAX index on Friday. Stock markets have also fallen due to the ongoing worries about growth and deflation, though the fact that US interest rates have remained at historically low levels for longer is helping to limit the downside. As far as gold is concerned, the dollar’s movements are likely to have a big say in the near-term direction of the precious metal. As many, including ourselves, believe that the US currency still remains in a long term upward trend, gold may struggle to rise significantly from these levels. As well as our long-term bullish view on the dollar, global inflation is still almost nonexistent and falling. This also bodes ill for the metal. Nevertheless, we could easily see some further gains in the very short-term outlook, before the metal falls back.
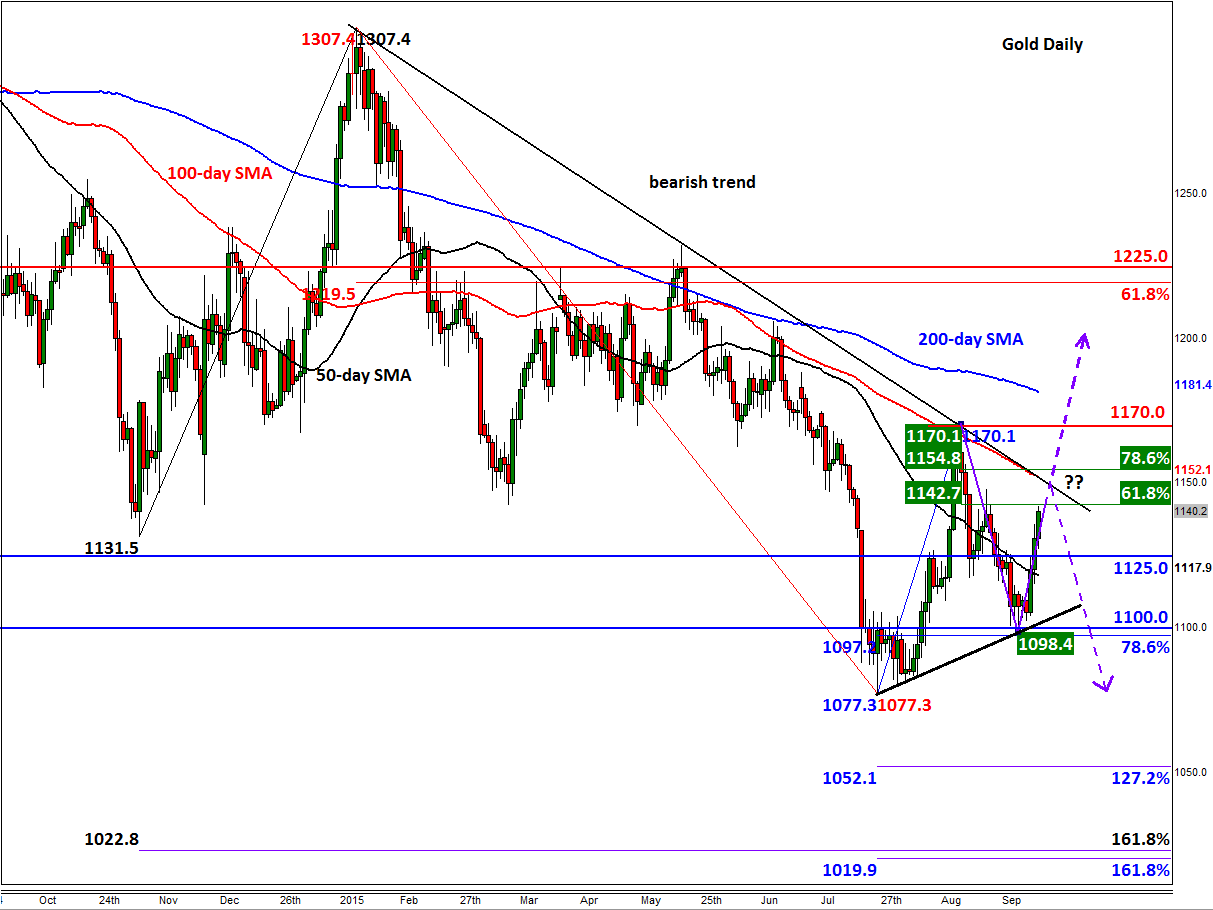
Following the FOMC’s decision to leave rates unchanged, gold rallied and took out the key $1125 resistance level. As a result, the metal has been climbing towards $1143/5, an area which marks the 61.8% Fibonacci retracement of the move down from $1170. Slightly higher, at around $1150, is the convergence of the 100-day moving average with a bearish trend line that has been in place since January. In other words, key resistance levels are now approaching and depending on what happens here, we could see some sharp moves early next week. Given the fact that gold has been rallying for three consecutive days, it is likely that we will see some profit-taking around here which could see the metal drop back towards $1125 initially and possibly lower over time. However, if $1143/5 fails to hold as resistance then we could see the onset of a much sharper rally, at least towards the previous high of $1170. Further bullish targets could be around $1180/1, the 200-day moving average, followed by the longer-term 61.8% Fibonacci retracement at just below $1220.
Meanwhile on the downside, as well as the aforementioned support at $1125, traders will need to keep a close eye on short-term bullish trend line which comes in some distance above the next key support level of $1100. If the trend breaks then it is likely that gold may then push below $1100 as well before potentially revisiting the low from July at $1077.
Source: FOREX.com. Please note this product is not available to US clients
Monday, September 21
1400GMT – US existing home sales (August)
After last week’s rather uneventful policy meeting at the Fed, the market is still attempting to determine when the bank will begin its tightening cycle, thus all US economic data takes on more market significance. Admittedly, existing home sales aren’t an overly important part of the policy mix, but it’s worth keeping an eye on the figures. In August, existing home sales are expected to be 5.5m.
Wednesday, September 23
0145GMT – Caixin China Flash Manufacturing PMI (September)
Concerns about the health of China’s massive economy are a major contributor to the recent turmoil in global financial markets: concerns which were sparked by abysmal manufacturing data. In August, we’re expecting a slight improvement in China’s private sector manufacturing index to 47.6 from 47.3, which is still well below the 50 level which separates optimists from pessimists.
0700GMT – French Flash Manufacturing PMI (September)
In July and August, French manufactures and the industrial sector had a poor couple of months. Manufacturing production fell 1.3% y/y in and a reading of manufacturing activity came in well below expectations in August. In September, we aren’t expecting much of an improvement in the Manufacturing PMI which suggests that Q3 GDP will in fact disappoint.
0730GMT – German Flash Manufacturing PMI (September)
The health of the economic heart of the Eurozone is very important for regional and even global investor sentiment. This time around the Markit Germany Manufacturing PMI is expected to fall to 54.5 from 54.9, but this is still comfortably within expansion territory, thus it shouldn’t concern the market.
2245GMT – NZ trade balance (August)
The health of the NZ economy is under a spotlight at the moment due to a deterioration of domestic economic activity and softening global economic conditions. To combat this, the RBNZ has been aggressively easing monetary policy in an attempt to stimulate the domestic economy, a move which is being supported by a rebound in dairy prices. The heavily export-based economy is expected to see exports slip in August to 3.58bn, from 4.2bn in the prior month.
Thursday, September 24
0800GMT – German IFO Business Climate Index (September)
In August, this index rose to a three-month high as temporary relief over Greece brightened the mood. This will likely fade this month, possibly leading to a slight deterioration of this index to around 107.9 (prior 108.3).
1230GMT – US durable goods orders (August) and unemployment claims
While no one is really questioning the health of the US labour market at the moment, it’s worth keeping one eye on the data in case it misses expectations which could lead to significant US dollar volatility. Meanwhile, durable goods orders are a good indication of economic activity in key US sectors, with the market expecting a 2.2% drop in August.
2330GMT – Japan CPI (August)
At its policy meeting last week the BoJ didn’t give any indications that it is preparing to increase its flow of stimulus into the economy, despite many indications that its current easing cycle isn’t going to be enough to prop up economic growth and inflation. The CPI is expected to jump only 0.1% y/y in August and core-CPI is expected to fall back into deflationary territory at -0.1% y/y, well below the bank’s extremely elusive 2% inflation target.
Friday, September 25
1230GMT – US Final GDP (Q2)
This is the third and final release of Q2 US GDP numbers. We are expecting the figures to confirm what the market already knows: that the US economy grew at an annualized pace pf 3.7% last quarter. Personal consumption and the GDP Price Index are expected to rise 3.1% and 2.1% respectively, matching the last set of numbers.
Disclaimer: The information and opinions in this report are for general information use only and are not intended as an offer or solicitation with respect to the purchase or sale of any currency or CFD contract. All opinions and information contained in this report are subject to change without notice. This report has been prepared without regard to the specific investment objectives, financial situation and needs of any particular recipient. Any references to historical price movements or levels is informational based on our analysis and we do not represent or warranty that any such movements or levels are likely to reoccur in the future. While the information contained herein was obtained from sources believed to be reliable, author does not guarantee its accuracy or completeness, nor does author assume any liability for any direct, indirect or consequential loss that may result from the reliance by any person upon any such information or opinions.
Futures, Options on Futures, Foreign Exchange and other leveraged products involves significant risk of loss and is not suitable for all investors. Increasing leverage increases risk. Spot Gold and Silver contracts are not subject to regulation under the U.S. Commodity Exchange Act. Contracts for Difference (CFDs) are not available for US residents. Before deciding to trade forex and commodity futures, you should carefully consider your financial objectives, level of experience and risk appetite. Any opinions, news, research, analyses, prices or other information contained herein is intended as general information about the subject matter covered and is provided with the understanding that FOREX.com is not rendering investment, legal, or tax advice. You should consult with appropriate counsel or other advisors on all investment, legal, or tax matters. FOREX.com is regulated by the Commodity Futures Trading Commission (CFTC) in the US, by the Financial Services Authority (FSA) in the UK, the Australian Securities and Investment Commission (ASIC) in Australia, the Financial Services Agency (FSA) in Japan, the Investment Industry Regulatory Organization of Canada (IIROC) in Canada and the Securities and Futures Commission of Hong Kong (SFC) in Hong Kong. Please read Characteristics and Risks of Standardized Options.
