Technical Developments to Watch:
- EUR/USD peeking above 1-year bearish trend line, but Greece concerns loom
- GBP/USD holding at a new YTD high near 1.5900
- USD/JPY marking time between 123.00 and 124.00
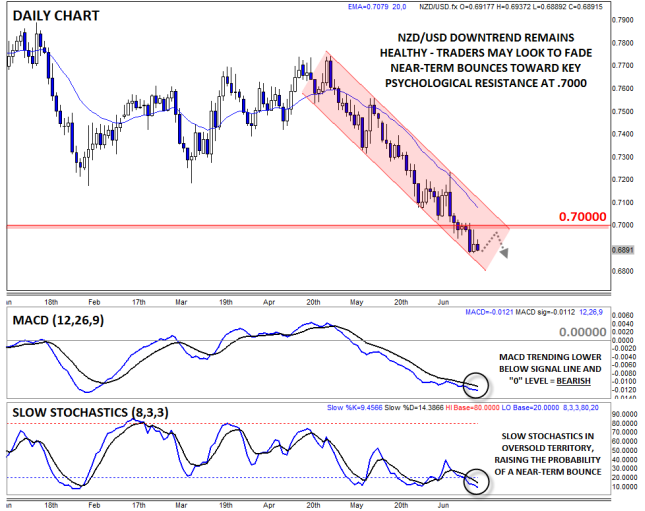
- NZD/USD in play, trend remains lower beneath key psychological level at .7000
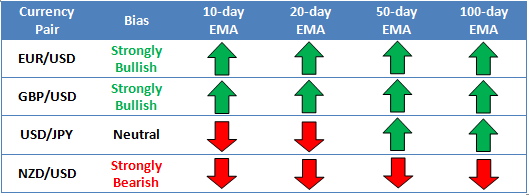
* Bias determined by the relationship between price and various EMAs. The following hierarchy determines bias (numbers represent how many EMAs the price closed the week above): 0 – Strongly Bearish, 1 – Slightly Bearish, 2 – Neutral, 3 – Slightly Bullish, 4 – Strongly Bullish.
** All data and comments in this report as of Friday’s European session close **
EUR/USD

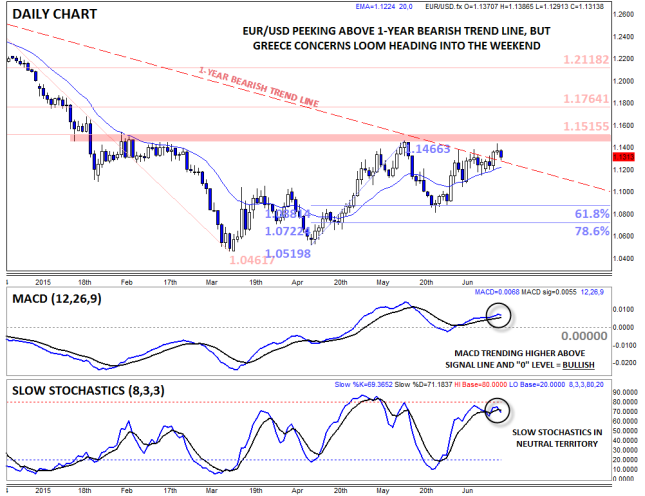
- EUR/USD peeked above its 1-year bullish trend line before turning lower Friday
- MACD still edging higher, Slow Stochastics in neutral territory
- Cautiously bullish above 1.13, but all eyes will be on the Greek debt situation over the weekend
EUR/USD rallied through its one-year bearish trend line last week, propelled on the Fed’s less-hawkish-than-expected outlook on Wednesday. As of writing though, the pair is fading back toward 1.1300 on the rising probability of a Greece default as we head into the weekend. Meanwhile, the MACD is trending higher, signaling bullish momentum and the Slow Stochastics have yet to reach overbought territory, so there could still be some juice left in the rally. If we see an extension to Greece’s financing over the weekend, EUR/USD could look to target previous resistance near 1.1500 in the coming week, but the pair will struggle to rally sustainably as long as Greek fears loom.
Source: FOREX.com
GBP/USD

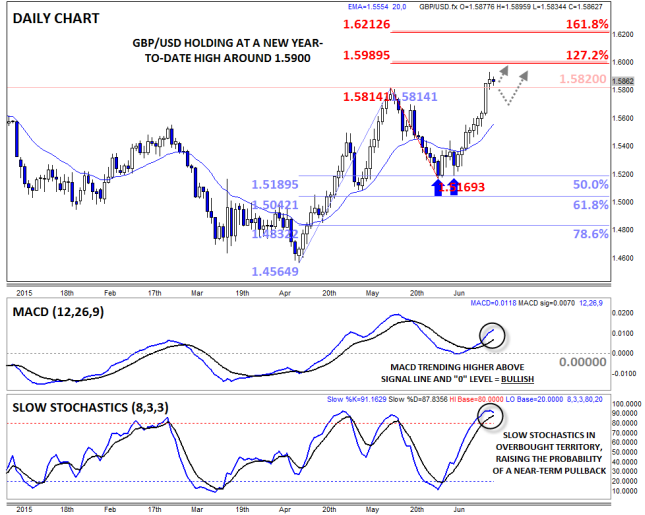
- GBP/USD rallied consistently last week, tagging a new YTD high above 1.5820
- MACD shows bullish momentum, but Slow Stochastics now overbought
- Pullback possible after nine consecutive up days, but bullish trend remains healthy
GBP/USD once again rallied consistently last week, reaching a new year-to-date high above 1.5900 on Thursday before pulling back modestly as we go to press. The big breakout above previous resistance at 1.5820 bodes well for bulls, as does the rising MACD indicator, though the overbought Slow Stochastics hint at the potential for a pause or pullback to digest the recent gains. Moving forward, more conservative traders may look to accumulate GBP/USD on dips, with an eventual move toward converging 127.2% Fibonacci extension and psychological resistance at 1.60.
Source: FOREX.com
USD/JPY

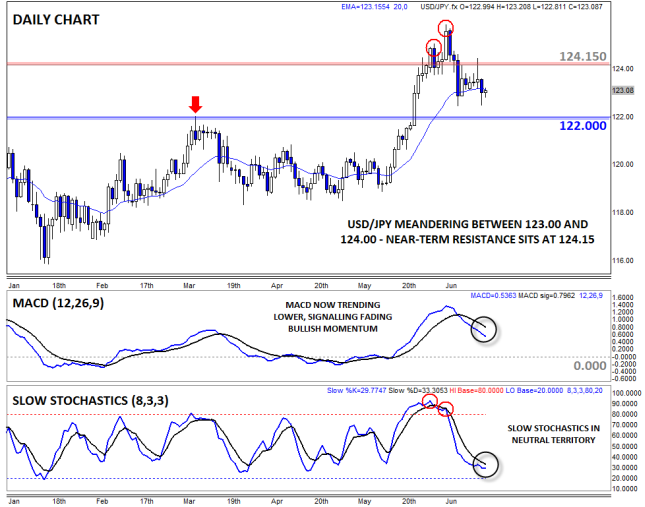
- USD/JPY treaded water between 123 and 124 in slow trade last week
- MACD rolling over, signaling declining bullish momentum
- Bias remains generally lower below the previous 13-year high at 124.15
USD/JPY merely marked time in lackluster trade between 123.00 and 124.00 last week, despite the FOMC meeting and BOJ minutes. As we noted last week, the coordinated jawboning by the BOJ and Japan’s government marked a sharp shift in currency policy from the central bank and could lead to a potentially important medium-term top in USD/JPY. For its part, the MACD is now clearly trending lower, signaling fading bullish momentum, and the bias on USD/JPY will therefore remain lower this week as long as the pair holds below the previous 13-year high at 124.15, and more generally, last week’s high near 126.00.
Source: FOREX.com
NZD/USD

- NZD/USD fell through key psychological support at .7000 last week
- MACD shows strongly bearish momentum, but Slow Stochastics still oversold
- Traders may favor fading near-term rallies to previous-support-turned-resistance at .7000
NZD/USD is our currency pair in play this week due to a number of high-impact economic reports out of New Zealand, China, and the US (see “Data Highlights” below for more). Last week, NZD/USD extended its selloff on continued weak economic data in Kiwi nation, leaving the pair trading below .6900 as we go to press. Not surprisingly, the MACD continues to show strongly bearish momentum, while the Slow Stochastics are in oversold territory. At this point, the strong downtrend favors sell trades, but prudent traders may prefer to fade any near-term rallies toward the .7000 level to join the trend at value.
Why Won’t EUR React to Greece?
At the end of a week when Greece remains teetered precariously on the precipice of bankruptcy and Eurozone expulsion, the EUR is poised to end the week higher versus the USD. Gone are the days when the EUR would tumble 300-400 pips on a stalemate between Greece and her creditors, so what is going on and is this the calm before the storm for the single currency?
We think that this time the market is reacting differently to the Greek crisis for a few reasons:
- Greece is considered a political problem, not a financial problem: thus, it should not have a long-term impact on EUR-based assets
- Ireland, Spain and Portugal are in stronger fiscal and economic positions than they were in 2010 and 2012, so the risk of contagion is much reduced
- The radical political backdrop in Greece is not replicated across other peripheral nations
- The private sector only has limited exposure to Greece, thus recent declines in Greek asset prices do not mean that there has been enhanced downward pressure on other peripheral European markets
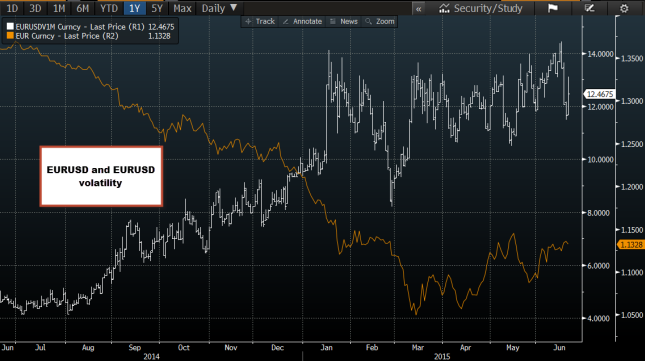
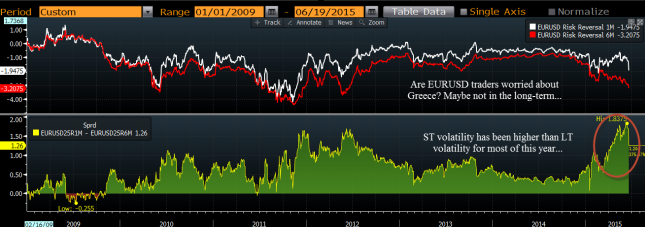
This does not mean that the market is oblivious to the Greek risks. Interestingly, the spot market is fairly sanguine, but there has been a lot of activity in the options market. This suggests that traders are hedging their bets, putting upward pressure on EUR/USD one-month volatility, as you can see in Figure 1. Digging a bit deeper into EUR/USD volatility, we used our Bloomberg terminal to measure the spread between one-month implied volatility and six-month implied volatility for EUR/USD, as you can see in Figure 2. The conclusion is interesting: one-month volatility has been consistently higher than six-month volatility for most of this year. Usually, one would expect uncertainty about a currency to rise over time, not to fall; after all, none of us can predict the future.
So, what is going on? The rise in short-term volatility suggests to us that the market is concerned about a Greek default and expulsion from the Eurozone and the disruption this could cause to risky asset prices. However, if Greece is cut loose, in the longer term this should not impact the single currency. Cast your mind back to 2012, the last time that Greece teetered on the brink of bankruptcy and Eurozone expulsion, and the ECB chief Mario Draghi said that he would do “what it takes” to save the Eurozone. This calmed Greek fears and caused risky assets to rally. We have reached the moment where someone needs to stand up and say they will do all that it takes to save Greece to keep it in the currency bloc. This would be the only outcome, in our view, that can stem the 18% decline in the Greek stock market over the last week and cap Greek bond yields. But this time though, there is a big difference; saving Greece is not the same thing as saving the Eurozone. The market is not pricing in a catastrophe for the EUR, and it appears to be fairly confident that the single currency will continue to exist in the future.
For this reason, we continue to stick with our view that EUR/USD will not fall back to this year’s lows at 1.05 in the coming months. Instead, we would expect a knee-jerk reaction lower towards 1.12 and then 1.1050 if we don’t see a breakthrough during Monday’s European leaders summit on Greece. If the selloff is sharper then we expect, then we may even break this level and get back to 1.08; however, in the long-term we are neutral on the EUR. The reasons are twofold:
- Greece is considered a political problem, not a financial problem, and thus should not have a long-term effect on EUR-based asset prices
- The Fed has stated its sensitivity to dollar strength, which could limit upside in the greenback over the summer months
Thus, we’re not giving up on the single currency, and any selloff post Monday’s summit could be a decent buying opportunity.
Figure 1: Although EUR/USD has been rising this week, so too has EUR/USD volatility…
Source: FOREX.com and Bloomberg, please note that this chart does not refer to the prices offered by FOREX.com
Figure 2: Longer-term volatility is lower than short-term volatility, which is unusual in the FX market and suggests faith in the existence of the EUR in the long-term.
Source: FOREX.com and Bloomberg
Look Ahead: Stocks
Stocks markets rebounded strongly in the latter half of the week, most notably on Thursday. But with the Greek situation still unresolved, it remains to be seen whether next week will bring out the buyers for European stocks. Sentiment has improved slightly on the back of strong US macroeconomic data and a somewhat dovish Fed. Together, these factors have inspired a rally on Wall Street, which saw fresh all-time highs for the Nasdaq Composite and Russell 2000 indices on Thursday. The dollar bounced back after dropping sharply on Wednesday, causing the EUR/USD to ease off a tad and by Friday morning (when this report was written) it was back at 1.1300 after rallying to a high of 1.1435. The relatively weaker euro boosted the appeal of European exporter and was thus another reason why the markets bounced back. But Greece remains a near term concern, though some of the bad news has now been priced in. There were rumors on Thursday that the EU and ECB would extend the deadline for funding until the end of the year. This will have allowed Athens to avoid a default at the end of this month. But the Eurogroup meeting ended with no such an agreement. So it remains to be seen whether a deal for Greece may finally be sealed before Greece runs out of cash at the end of the month. Another Eurogroup meeting is scheduled for Monday and there is little doubt Greece will be top of the agenda.
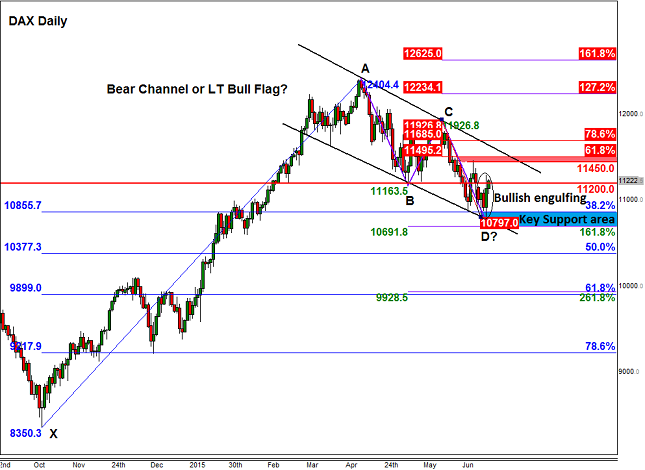
As well as the weaker euro and positive vibes coming out of Wall Street, European stocks were boosted by short-side profit-taking ahead of the weekend. Take the DAX as an example. On Thursday, we highlighted the importance of a key area of support between 10690 and 10855. The upper end of this range corresponds with the 38.2% Fibonacci retracement of the upswing from October. This represents a very healthy and shallow pull back inside a long-term bull trend. Shrewd speculators are aware that strong bull trends typically only manage a retracement of this magnitude before pushing higher again. But even if the DAX goes on to take out the 38.2% Fibonacci level, the lower end of the abovementioned support range, at 10690, may hold as support. That’s because this level corresponds with the 161.8% extension of the last notable (and short-lived) upswing we saw in May (i.e. of the BC swing), which is a potential exhaustion point for the bears. In addition, 10690 also represents the point D of an AB=CD pattern and thus a Bullish Bat/Gartley pattern, too. Making it even more intriguing is the fact that the point D comes in right at the support trend of the bearish channel, though this will partly depend on the speed of the index’s potential drop to this level.
But that is if the DAX gets there in the first place because, as mentioned, the index has already bounced back from the upper end of the support range, so it could head much higher from here. Indeed, the index has created a large bullish outside candlestick formation following Thursday’s upsurge. This suggests that there was a strong shift from selling to buying activity. At the time of this writing, the index was hovering around the pivotal 11200 mark and remained on course to head towards the next potential resistance at 11450. Thereafter is the 61.8% Fibonacci retracement of the downswing from May, at 11495, then the resistance trend of the bearish channel around 11600-30 (depending on how fast the index will get there, if it does). If and when the index breaks out of the bearish channel then the resumption of the long-term bullish trend would be confirmed.
Source: FOREX.com. Please note this product is not available to US clients
Look Ahead: Commodities
The significantly weaker dollar underpinned buck-denominated gold and silver quite noticeably on Thursday after the Fed delivered a more dovish-than-expected policy statement and press conference the day before. But the greenback was making a comeback at the end of the week after Thursday’s mostly stronger US data. Gold was therefore struggling to push further higher, trading flat at the time of this writing on Friday morning. Overall, we remain skeptical about this latest bounce in the price of gold. After all, the metal has hardly responded to the escalation of the crisis in Greece in recent past - Thursday being the exception. In other words, the behavior of price action calls into question the metal’s status as a safe haven asset. There is also some speculation that Greece may be forced to sell its gold reserves to make up the IMF payment due at the end of the month. Selling gold by a central bank would most likely weigh on prices. On top of this, the rising government bond yields and significant outflows from gold ETFs in recent times means the probability of a big rally in the price of gold looks slim as we head into the next week.
From a technical point of view, gold's next move could be determined by what it does around the key $1205 area, which was tested on Thursday. As can be seen on the chart, several technical factors converge around $1205, making a potential pullback here likely. As well as this area being previous resistance, the 200-day moving average and the 61.8% Fibonacci retracement level of the last downswing come into play. Thus, a pullback towards the $1190 and potentially beyond could be a possibility. However, with the MACD creating a bullish crossover, the buying pressure is apparently building up which points to a possible breakout. If seen, the next hurdle the bulls will have to tackle is at $1210 which corresponds with the bearish trend line. Beyond that level is the May high at $1332/3 and then the 61.8% retracement of the price swing from January, at $1244/5. Indeed, gold has made a couple of higher lows already. So, who knows, it may have already formed a base and could be on the verge of a big breakout next week. For now, though, we remain skeptical until proven wrong.
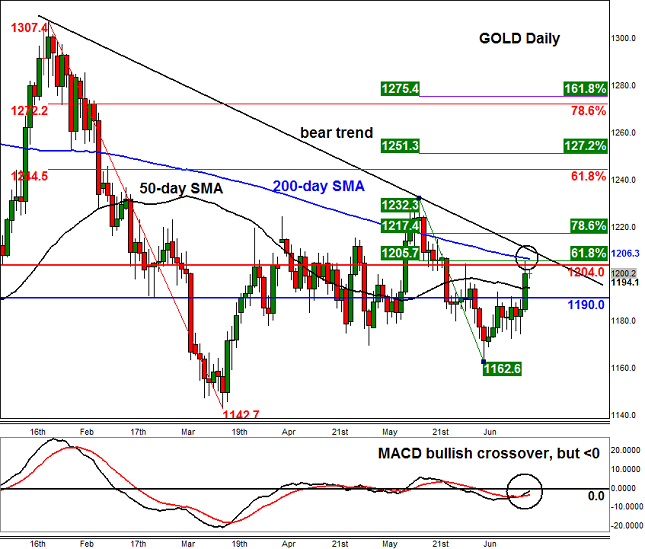
Source: FOREX.com

Source: FOREX.com. Please note, this product is not available to US clients
Global Data Highlights
Global Data Highlights
UK:
23rd June 1000 GMT: CBI industrial trends, June
There is a lack of domestic economic data in the UK this week, which likely means that the chief focus will be on developments in Greece. The data highlight will be the CBI surveys, the first of which is the industrial sentiment survey. This survey has fallen back in recent months, after reaching a 6-month peak in December. The market is looking for an end to the weakening in this trend for June, which could signal a new lease of life for the UK’s industrial sector. Overall, we don’t think this survey will have much impact on the pound.
25th June 1000 GMT: CBI reported sales, June
This is a timely indicator of sentiment in the retail industry. This survey had a strong reading for May, rising to its highest level since the start of the year, but the market is expecting a moderation for June. The risk is to the upside, however, after a recent uptick in wage data that could boost consumer confidence. A strong reading may boost upward pressure on the pound in the short term.
Eurozone:
22nd June 1400 GMT: Consumer confidence, June
This is the first reading of consumer confidence for this month, and the market expects a tick down to -5.8 from -5.5 in May. This would still be a fairly high level compared to readings for the last 2.5 years. However, the risks are to the downside on the back of heightened Greek default fears, which is likely to knock confidence across the region. Due to more pressing events, such as Greek default fears, we believe that this survey is unlikely to have a big impact on the EUR.
23RD June 0800 GMT: Eurozone PMIs, June
This is the most important data point of the week as it is a clear insight into how the European economy performed at the end of Q2. The market expects fairly upbeat readings with only moderate declines in the services sector reading from 53.8 to 53.5. The composite survey is expected to remain at 53.5, down a touch from 53.6. The risk is that Greek fears knock sentiment, however we are interested to see how well the services and manufacturing sectors have weathered the latest Greek storm. A weaker-than-expected reading could weigh on the single currency.
US:
23rd June 1230 GMT: Durable Goods orders, May
The market is expecting another decline in the headline data, however it is the ex- transportation number that we are interested in and this is expected to rise by a fairly decent 0.6%, which would be one signal that the US economy is bouncing back after a weather-related slowdown in Q1. We think this number could impact the dollar, as the market focuses on the US economy in the wake of the last FOMC meeting, where Fed chair Yellen said that a rate hike is all data dependent. Thus, a big outlier could lead to dollar volatility.
24th June 1230 GMT: GDP Q1
This is the second reading of US GDP for the first quarter. The market expects an upward revision to -0.2% from -0.7%, which would suggest that the US economy did not have such a deep weather-related slowdown in Q1 as first thought. If the data is revised higher then we could see the dollar rally, as this lowers the bar for a rate hike down the line.
25th June 1330 GMT, PCE, May
This is the Fed’s preferred measure of inflation, and is thus worth watching closely. The PCE deflator and core rate are both expected to rise on the month by 0.4% and 0.1% respectively. This will still leave the US CPI rate below the Fed’s target 2% level; however, it would suggest that energy prices are stabilizing and the US is moving out of deflationary territory. A stronger-than-expected reading could boost the buck.
26th June 1400 BST: University of Michigan consumer sentiment, June
The week ends with consumer confidence data, which is expected to remain steady at 94.6, which would be at a fairly elevated level relative to the last six years. Watch long-term inflation expectations, which were at 2.7% in May. If we see this number creep up then it could increase pressure on the Fed to hike rates, which could boost the dollar.
