In chess, a stalemate is a drawn game. Chess players study endgames, where small advantages become big wins. Computers have now solved these endgames – all of them! Some require dozens of precise moves. A mistake converts a draw into a win or a loss. Humans make mistakes.
Political processes are inherently human. It is possible to estimate the outcomes, but there is plenty of room for surprises along the way. I have been analyzing public policy issues for forty years, including the study of hundreds of actual decisions as part of my dissertation – the original research required to get your "professor credentials." I do not have any exaggerated illusions about the predictive power of academic research, but at least for me, the research has helped to identify investment implications.
There are certain principles that hold up with amazing frequency in the US political process, and more generally in democratic systems:
- If a particular outcome is clearly beneficial to nearly everyone, that result will usually be achieved.
- The process of bargaining and compromise is always messy. It looks terrible to observers who have never personally experienced it.
- Compromise does not yield the best possible result. Instead, it generates the best result possible. Outsider each have an idea of the perfect solution. The problem is that there are many differing and inconsistent "perfect" solutions.
- No one really loves the result of a compromise.
- Every political issue is subject to compromise, even those that seem to involve strict rules.
Why dwell upon this in a blog dedicated to successful investing?
For the last three weeks I have accurately highlighted the political debate as a major concern for investors.
Investors who read last week's post saw that while I did not see a specific outcome in the week ahead, there were five things to watch:
- A temporary extension of the debt limit. This will be criticized by the punditry as "kicking the can" but it will serve the function of buying some needed time. The market will respond to the progress, not to the political wails of some pundits.
- Minimally, an agreement that provides some tweaking of sequestration and provides Speaker Boehner a chance to claim some credit.
- Maximally, a broader compromise on some entitlement and debt issues – less likely and taking longer.
- The agreement could be reached overnight or on a weekend, without much notice.
- The resulting pop in stocks (just like the fiscal cliff resolution) will leave many chasing the market, waiting for a pullback.
This proved to be a fairly accurate assessment. As I write this, the situation is changing almost by the hour. Yesterday the emphasis was on the Senate. Today it is on the most recent proposals from Republicans in the House.
The biggest element missing from the five points listed above is the political cover for Speaker Boehner. Poll results showing blame falling mostly on Republicans seem to have stiffened the resolve of Democrats. They are now asking for higher spending levels, easing the sequestration rules. The principle highlighted by the administration is not to allow the debt limit threat as the foundation for policy negotiations. The principle highlighted by Republicans is the need to use maximum leverage to achieve goals viewed as important.
An Important Distinction about Politics
Regular readers know that I strongly recommend separating your political viewpoints from your investing. You should join me in being politically agnostic—willing to invest successfully no matter who is in power.
It is fine to have an opinion about ObamaCare, about debt, about European leadership, or about the Fed. Feel free to express your viewpoints in personal discussions or in the ballot box. Stop there. Confusing what you hope will happen with what probably will happen is the fast track to investment losses!
When I discuss policy issues, I am helping you to predict what will probably happen and also the investment consequences. I have been extremely accurate on every important policy decision for many years – Europe, 2011 debt ceiling, fiscal cliff, etc. – often in disagreement with the majority of pundits. I have never expressed personal preferences, but instead emphasize how to profit from likely outcomes. I regularly cite sources covering a wide political spectrum. Discerning readers might note that I find the viewpoints of extremists of all types to be market-unfriendly. Mainstream thought, from whichever party, is better for investments, whatever your personal views.
The implication for investors is that gridlock leading to a default on U.S. debt is bad. This is an investment conclusion, not a vote on ObamaCare.
A New Theme: Earnings
In the absence of fresh economic data, the discussions will start early. The best and most recent update comes from earnings expert Brian Gilmartin. Brian explains why we should watch earnings closely, and especially monitor the forward 4-quarter estimate. He writes as follows:
In a nutshell, the reason we track the forward estimate growth rate and y/y change is that (in my opinion) it is the one metric that validates or "explains" an expansion (or contraction) in the SP 500′s p.e ratio, or what is otherwise known as P.E expansion. Although I can't prove it mathematically, it seems intuitive that if the growth rate of the forward estimate is increasing, then the SP 500′s p.e ratio can "expand" to keep pace with the presumed acceleration in "earnings expectations" or contraction as the forward growth rate slows.
Just like the bond market and the Federal Reserve are more concerned with "inflation expectations" than actual inflation that we can see in the data, I think the one component missed by strategists and the CNBC community is "earnings expectations" and the growth therein, and the one metric that quantifies this expectation is forward earnings, and yet we hear about it so very little.
I expect us all to be seriously focused on earnings by the end of this week.
I also have some thoughts on how the debt limit endgame will play out. I'll report on that in the conclusion. First, let us do our regular update of last week's news and data.
Background on "Weighing the Week Ahead"
There are many good lists of upcoming events. One source I regularly follow is the weekly calendar from Investing.com. For best results you need to select the date range from the calendar displayed on the site. You will be rewarded with a comprehensive list of data and events from all over the world. It takes a little practice, but it is worth it.
In contrast, I highlight a smaller group of events, including some you have not seen elsewhere. My theme is an expert guess about what we will be watching on TV and reading in the mainstream media. It is a focus on what I think is important for my trading and client portfolios. Each week I consider the upcoming calendar and the current market, predicting the main theme we should expect. This step is an important part of my trading preparation and planning. It takes more hours than you can imagine.
My record is pretty good. If you review the list of titles it looks like a history of market concerns. Wrong! The thing to note is that I highlighted each topic the week before it grabbed the attention. I find it useful to reflect on the key theme for the week ahead, and I hope you will as well.
This is unlike my other articles where I develop a focused, logical argument with supporting data on a single theme. Here I am simply sharing my conclusions. Sometimes these are topics that I have already written about, and others are on my agenda. I am putting the news in context.
Readers often disagree with my conclusions. Do not be bashful. Join in and comment about what we should expect in the days ahead. This weekly piece emphasizes my opinions about what is really important and how to put the news in context. I have had great success with my approach, but feel free to disagree. That is what makes a market!
Last Week's Data
Each week I break down events into good and bad. Often there is "ugly" and on rare occasion something really good. My working definition of "good" has two components:
- The news is market-friendly. Our personal policy preferences are not relevant for this test. And especially -- no politics.
- It is better than expectations.
The Good
With the shutdown limiting issuance of fresh government data, there was much less (non-political stuff) to ponder, and very little good news.
- Janet Yellen was nominated to be Fed Chair. This was widely expected, so it did not have much market impact. Yellen opponents should consult above for the definition of "good" as "market-friendly." Felix Salmon has some interesting ideas on how she can improve communications, an area where many of us have found Bernanke disappointing.
- Non-government indicators show strength. Scott Grannis has a chart pack that shows some optimistic market-based indicators. This is something we should all read in addition to the headlines!
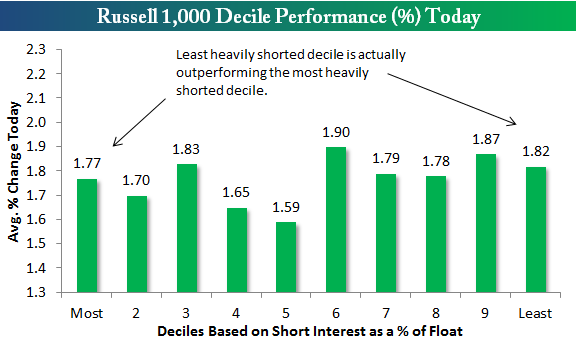
- The market bounce was not just short-covering. This is in sharp contrast to general media reports, so it is important to note. Bespoke provides the analysis including this chart:
The Bad
Despite the data shortage, there was some bad news.
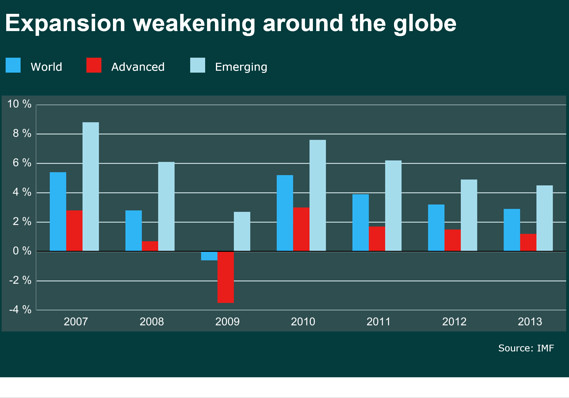
- The IMF warned on the threats to global growth and especially from the US debt ceiling issue.
- Jobless claims spiked higher. Partly this was the "California effect" as their computers caught up with recent claims. The overall level is still better than recent months, but there is more noise than ever. This will not diminish with the effects of the government shutdown.
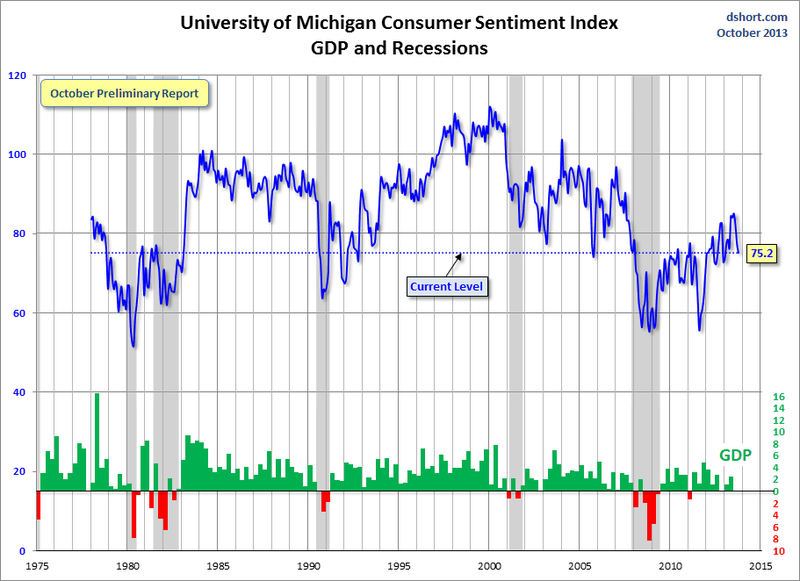
- Consumer sentiment, as measured by the University of Michigan, remains disappointing. There is a real chance that the political issues, even if resolved, will have an impact on confidence and the economy. Doug Short has my favorite chart for this indicator, showing the current level in the context of history and recessions:
Gallup also shows a decline in confidence (via Calculated Risk).
The Ugly
More investor confusion! Mark Hulbert notes that many newsletter writers make impossible, exaggerated claims. These often exceed the results of the best investors.
Who could have known?
One method seems to involve avoiding mark-to-market. You just book the winning trades and ignore the losers. Annualize returns. Presto!
Noteworthy
This week marked the Eighth Blogiversary for Abnormal Returns. Congratulations to Tadas for these years of pioneering excellence. He has helped to define the concept of content curation. His work is indispensable for all of us who follow markets and the economy. I use it constantly. Everyone also enjoys the touch of humor and personal interest links.
Well done!
The Indicator Snapshot
It is important to keep the current news in perspective. I am always searching for the best indicators for our weekly snapshot. I make changes when the evidence warrants. At the moment, my weekly snapshot includes these important summary indicators:
- For financial risk, theSt. Louis Financial Stress Index.
- An updated analysis of recession probability from key sources.
- For market trends, the key measures from our "Felix" ETF model.
Financial Risk
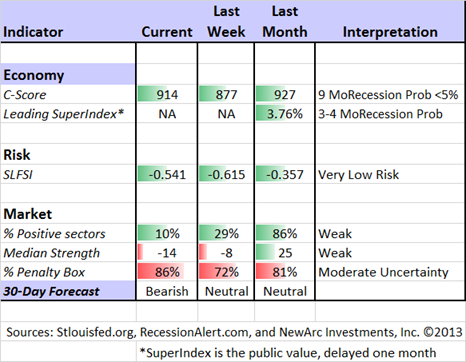
The SLFSI reports with a one-week lag. This means that the reported values do not include last week's market action. The SLFSI has recently edged a bit higher, reflecting increased market volatility. It remains at historically low levels, well out of the trigger range of my pre-determined risk alarm. This is an excellent tool for managing risk objectively, and it has suggested the need for more caution. Before implementing this indicator our team did extensive research, discovering a "warning range" that deserves respect. We identified a reading of 1.1 or higher as a place to consider reducing positions.
The SLFSI is not a market-timing tool, since it does not attempt to predict how people will interpret events. It uses data, mostly from credit markets, to reach an objective risk assessment. The biggest profits come from going all-in when risk is high on this indicator, but so do the biggest losses.
Recession Odds
I feature the C-Score, a weekly interpretation of the best recession indicator I found, Bob Dieli's "aggregate spread." I have now added a series of videos, where Dr. Dieli explains the rationale for his indicator and how it applied in each recession since the 50's. I have organized this so that you can pick a particular recession and see the discussion for that case. Those who are skeptics about the method should start by reviewing the video for that recession. Anyone who spends some time with this will learn a great deal about the history of recessions from a veteran observer.
I also feature RecessionAlert, which combines a variety of different methods, including the ECRI, in developing a Super Index. They offer a free sample report. Anyone following them over the last year would have had useful and profitable guidance on the economy. RecessionAlert has developed a comprehensive package of economic forecasting and market indicators, including this recent update on the world economy.
Georg Vrba's four-input recession indicator is also benign. "Based on the historic patterns of the unemployment rate indicators prior to recessions one can reasonably conclude that the U.S. economy is not likely to go into recession anytime soon." Georg has other excellent indicators for stocks, bonds, and precious metals at iMarketSignals. For those interested in gold, he has a recent update, asking when there will be a fresh buy signal.
Unfortunately, and despite the inaccuracy of their forecast, the mainstream media features the ECRI. Doug Short has excellent continuing coverage of the ECRI recession prediction, now two years old. Doug updates all of the official indicators used by the NBER and also has a helpful list of articles about recession forecasting. Doug also continues to refresh the best chart update of the major indicators used by the NBER in recession dating.
Readers should review my Recession Resource Page, which explains many of the concepts people get wrong. Most importantly, the concepts help you to stay invested when the "R word" is looslely used.
Our "Felix" model is the basis for our "official" vote in the weekly Ticker Sense Blogger Sentiment Poll. We have a long public record for these positions. Over the last month Felix has ranged from bearish to neutral to bullish and now back to bearish. The market has been moving back and forth around important technical levels, driven mostly by news.
Felix does not react to news events, and certainly does not anticipate effects from the headlines. This is usually a sound idea, helping the trading program to stay on the right side of major market moves. Abrupt changes in market direction will send sectors to the penalty box. The Ticker Sense poll asks for a one-month forecast. Felix has a three-week horizon, which is pretty close. We run the model daily, and adjust our outlook as needed.
The penalty box percentage moved higher this week. A high rating means that we have less confidence in the overall ratings.
[For more on the penalty box see this article. For more on the system ratings, you can write to etf at newarc dot com for our free report package or to be added to the (free) weekly ETF email list. You can also write personally to me with questions or comments, and I'll do my best to answer.]
The Week Ahead
This week's schedule will be dramatically affected by the government shutdown. Private data will assume unusual significance. Even if the government reopens, it will take several days to get the data machinery going again, including the September employment report.
The "A List" includes the following:
- Initial jobless claims (Th). Still interesting as the most responsive employment indicator, but very noisy due to California problems and the shutdown.
- The Fed Beige Book (W). This provides anecdotal information from around the country. It is part of the evidence in front of FOMC members at the next meeting, and sometimes influences market thinking about the economy.
- Leading economic indicators (F). Still popular with many market followers.
Bernanke is speaking on Monday. While the topic is the Mexican central bank, there are always policy questions. Bernanke speeches will now have a lower relevance factor.
Mostly we will be watching news about the debt limit negotiations.
How to Use the Weekly Data Updates
In the WTWA series I try to share what I am thinking as I prepare for the coming week. I write each post as if I were speaking directly to one of my clients. Each client is different, so I have five different programs ranging from very conservative bond ladders to very aggressive trading programs. It is not a "one size fits all" approach.
To get the maximum benefit from my updates you need to have a self-assessment of your objectives. Are you most interested in preserving wealth? Or like most of us, do you still need to create wealth? How much risk is right for your temperament and circumstances?
My weekly insights often suggest a different course of action depending upon your objectives and time frames. They also accurately describe what I am doing in the programs I manage.
Insight for Traders
Felix has switched to a bearish posture. For our trading accounts we decreased positions to 2/3 long. The long positions are rather defensive. This is not a short position, but we could find ourselves buying the lightened up at mid-week, but we are once again fully invested. This happens when we find three or more attractive sectors, even in a neutral or soft market. Felix's ratings have been in a fairly narrow range for several months. The rapid news-driven shifts are not the ideal conditions for Felix's three-week horizon. The high penalty box rating continues to underscore the uncertainty.
Insight for Investors
The challenge for investors is to distinguish between the major trends and the short-term uncertainty. The main themes are not related to headlines news, even though sentiment may drive market fluctuations. Do not be seduced by the idea that you can time the market, calling every 10% correction. Many claim this ability, but few have a documented record to prove it. Most who claim past success are using a back-tested model. Please see The Seduction of Market Timing.
Last week was a perfect illustration of how difficult it can be for investors to adjust when there is breaking news. Many who choose to go "all out" because of fear have no plan for re-entering when the risk is lower. Eddy Elfenbein – as he does so often – provides excellent historical perspective. Much was made of VIX levels (the implied volatility gauge that many view as the fear index) reaching 20. Eddy writes as follows:
But viewed in proper perspective, a VIX of 20 really isn't that high. It's just that recent volatility has been so low. Last quarter, the S&P 500 had an average daily volatility of just 0.45%, which was a seven-year low. The S&P 500's close on Tuesday was 4% below the all-time high close from a few weeks ago. In 2011, the market fell nearly 20%.
(Geeky math interlude: If you're curious as to what exactly the VIX measures, it's the market's estimate for the S&P 500's volatility over the next 30 days. The number is annualized, so we can get it down to one month by dividing the VIX by the square root of 12, which is roughly 3.46. That gives us the market's one-standard-deviation estimate for the S&P 500's plus/minus range for the next month.)
Let's take a step back and remember that during the last Debt Ceiling fight two years ago, the VIX came near 50. During the height of the Financial Crisis, the VIX topped 80. Traders are nervous today over a 20 VIX. The VIX was above 20 almost continuously for five straight years during the late 1990s and early 2000s. The stock market is far calmer today.
I recently wrote about how investors can manage risk, specifically considering the role of bonds and the risk of bond mutual funds. As I emphasized, "You need to choose the right level of risk!" Right now, it is the most important question for investors. There is plenty of "headline risk" that may not really translate into lower stock prices. Instead of reacting to news, the long-term investor should emphasize broad themes.
And finally, we have collected some of our recent recommendations in a new investor resource page -- a starting point for the long-term investor. (Comments and suggestions welcome. I am trying to be helpful and I love feedback).
Final Thought
As I have noted in recent weeks it is very difficult to trade around the Washington headlines. For long-term investment positions I use the fluctuations as opportunities to adjust positions, not as major risk factors. My current working hypotheses include the following:
- There is a real chance that no solution will be reached by the official D-Day – Thursday. Stan Collender puts the odds at worse than 50-50. That was also the verdict on several of the Sunday morning talk shows. Senate action will be further delayed since many procedures require unanimous consent to avoid delay. Some objectors are now calling for votes on unrelated issues.
- There will not be an actual default on Thursday. Here is a better timeline. We might still be wrapping up this issue next weekend.
- Whenever you can see overlap in the positions of two opposing parties, the eventual resolution is just a matter of time. There is pressure on the GOP from business leaders. There is pressure on Obama because of the very real effects. There is pressure on everyone from declining approval in polls.
- The eventual solution will combine some face-saving accomplishments for the GOP while also avoiding any precedent-setting notion of success. This is actually the trickiest point.
Daily trading will react and over-react to each piece of news, beginning with a soft opening tomorrow. This will all soon be forgotten, with a renewed focus on corporate fundamentals.
Biggest risk: The longer the issues drag on, the greater the chance that reduced consumer and business confidence has a real effect.


