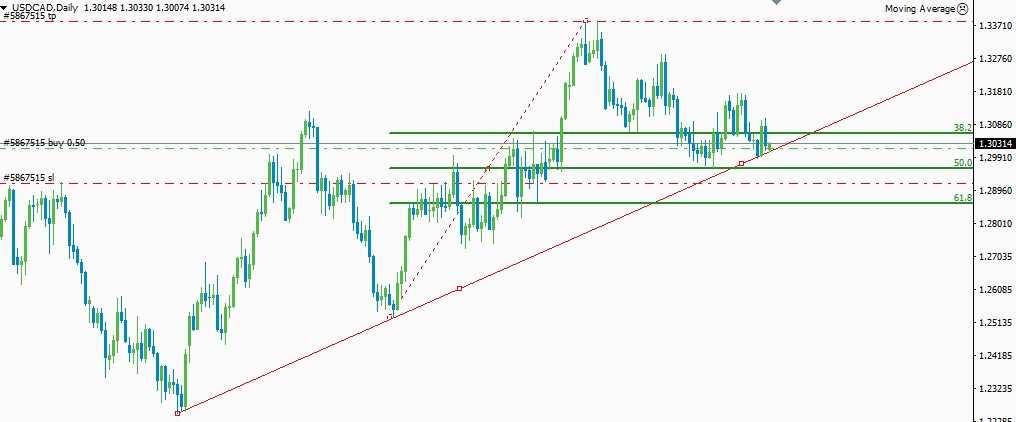
The USD/CAD pair has lost its bullish momentum after hitting a major resistance level at 1.33794. Most of the short-term investors closed their long trade as the pair formed a bearish pin bar right at the major resistance level. Currently, the pair is testing the medium term trend line support level at 1.30126. Though we had a nice bullish engulfing pattern in the daily chart the conservative traders are still waiting for a clear break of the minor resistance level at 1.3060 level execute fresh long orders.
USD/CAD daily chart analysis
Figure: USD/CAD testing major trend line support
From the above figure, you can clearly see the pair has found some decent support at the bullish trend line. This support level is also reinforced by the 50% Fibonacci retracement level drawn from the low of 1st February 2018 to the high of 22nd June 2018. Most of the aggressive price action traders in the CFD trading industry went long after the formations of the bullish engulfing pattern right at the trend line support level. The first bullish target for this pair is the high of 15th August 2018. A daily closing of the price above the critical resistance level at 1.31657 will refuel the USCAD cad bulls in the global market. Once the bulls are fueled up the ultimate target for this pair would be the high of 22nd June 2018. A daily closing of the price above the major resistance level at 1.33794 will open the door for the extended bullish rally.
On the downside, the pair needs to break below the major support level at 1.29577 to establish strong bearish momentum. But breaking this level will be extremely hard as we have 50% Fibonacci retracement level. But a weekly closing of the price below the 50% retracement level will change the overall bias of this pair from bullish to bearish. The first initial bearish target for the USD/CAD pair is the 61.8% retracement level. This level is going to provide a significant amount of buying pressure on this pair. A clear break of the 61.8% retracement level will confirm the end of the medium-term bullish rally and the bears will again take control of this market.
Fundamental factors
Fundamentally the recent performance of the U.S economy is relatively stable compared to the previous two months. FED officials are expecting a decent growth in the U.S economy due to the positive consumer sentiment data. Moreover, FED chairman Jerome Powell has given a clear hint about next rate hike prior to the closing of the year 2018.
Technically the overall bias for the USD/CAD pair is still bullish. Unless the bears manage to clear out the cortical support level at 1.29577, selling the pair would be an immature act. But a clear break of the 61.8% bearish retracement level will result in a larger decline and this will eventually lead this pair towards the next major support level at 1.25214. This level is very important for the long-term investors and we might see some decent bullish bounce. Any bullish price action signal will be an excellent opportunity to execute long orders in this pair. However, a clear break of the price below the critical resistance level at 1.25214 will lead this pair towards the low of 1st February 2018.
In the weekly chart, the pair is still forming nice higher high associated with higher lows, which strongly suggest the bulls are still in control of this market. However, the current price level is very crucial since a break of this level will confirm the end of a medium-term bullish rally in the USD/AD pair. Considering the daily and weekly technical parameters, we should look for buying opportunity as long as the 50% retracement level holds.
