Want to add another awesome indicator to your arsenal?
How about checking out the McClellan Oscillator. It’s one of the most popular market breadth indicators around and sadly I have not done enough to cover it on the blog in detail.
So this post is 110% devoted to McClellan and his Oscillator!
What Is It & How Is It Calculated?
Without getting to complicated, the McClellan is a market breadth indicator that is actually based on the Advance/Decline issues from the NYSE. It’s a smoothed indicator that tries to remove the daily noise and give an easier to use signal for traders.
Each day the indicator takes the difference between an approximate 19-day EMA and a 39-day EMA of advancing minus declining issues. This helps us establish a relative measure of broad-based market participation.
But enough with the geeky calculations…
How Does Market Breadth Help Me?
Technical indicators that use measures of advancing or declining stocks generally will give you some insight into the amount of participation in the current trend’s movement. This is referred to as the market “breadth.”
In a raging and healthy bull market, there will be a large number of stocks making price advances. Sure you will have a few stocks here and there that decline but overall the general market is advancing on a broad scale.
On the other hand, a weak market will see only a very small number of stocks advancing (but advancing at larger prices). This gives the false appearance that the market is healthy when the underlying fundamentals tell a different story. In this case only a few stocks are leading the way while the majority of stocks are lagging or declining.
This type of divergence in advancing/declining issues often signals an end to the trend and of course the opposite happens in bottoming markets.
The Buy/Sell Signals
There are 2 main signals given by the McClellan Oscillator. In all honestly most people get them completely confused and use them incorrectly (at least in my opinion).
You first have to understand that there are 4 “trading zones” to this indicator. On the top side there is an overbought region between +70 and +100. Any above +100 is considered extremely overbought. Likewise on the bottom side with -70 and -100.
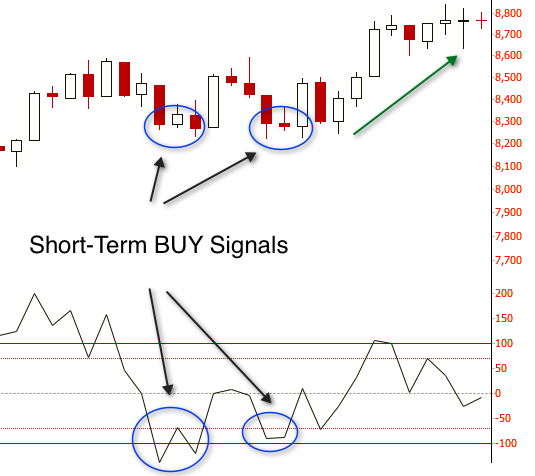
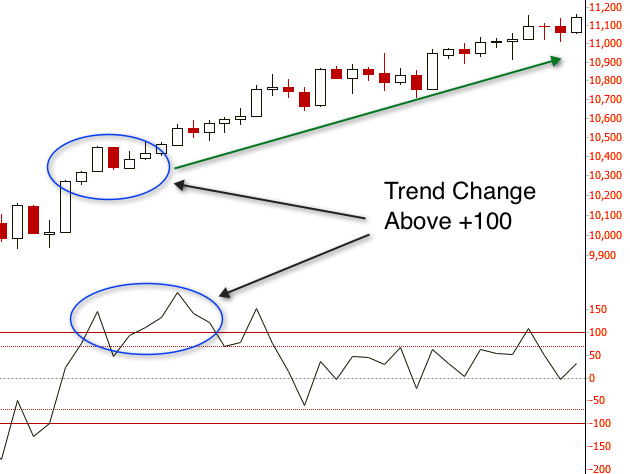
If the M.O. falls to -90 and turns back up a short term buy signal is generated. However, if the indicator slams through the -100 level then it actually signals the start of a new downtrend and you shouldn’t be buying. This is where some traders fall into a deep and painful trap. 
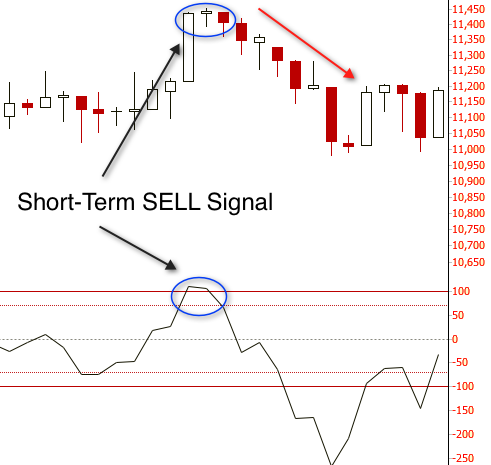
In up-trends the same came be said. If the M.O. climbs to +90 and turns over a short term sell signal is generated. Again, if it continues past the +100 level then a new bull market move is starting and you shouldn’t be selling just yet.
What Do You Think About Divergence?
Time for some community engagement.
As with nearly all momentum and breadth indicators, I believe divergence plays a key role in identifying solid signals. I don’t use the McClellan Oscillator as a stand-alone indicator; but rather pair it up with RSI and Stochastics to get more meaningful alerts while watching for clear signs of bullish/bearish divergence.
That’s just what I think…what do you think about using this indicator with divergence? Has it worked or not worked for you in the past? Add your comments to this post and share your opinion.
- English (UK)
- English (India)
- English (Canada)
- English (Australia)
- English (South Africa)
- English (Philippines)
- English (Nigeria)
- Deutsch
- Español (España)
- Español (México)
- Français
- Italiano
- Nederlands
- Português (Portugal)
- Polski
- Português (Brasil)
- Русский
- Türkçe
- العربية
- Ελληνικά
- Svenska
- Suomi
- עברית
- 日本語
- 한국어
- 简体中文
- 繁體中文
- Bahasa Indonesia
- Bahasa Melayu
- ไทย
- Tiếng Việt
- हिंदी
The Ultimate Guide To Using The McClellan Oscillator For Market Breadth
Published 04/17/2012, 08:28 AM
Updated 07/09/2023, 06:31 AM
The Ultimate Guide To Using The McClellan Oscillator For Market Breadth
3rd party Ad. Not an offer or recommendation by Investing.com. See disclosure here or
remove ads
.
Latest comments
Install Our App
Risk Disclosure: Trading in financial instruments and/or cryptocurrencies involves high risks including the risk of losing some, or all, of your investment amount, and may not be suitable for all investors. Prices of cryptocurrencies are extremely volatile and may be affected by external factors such as financial, regulatory or political events. Trading on margin increases the financial risks.
Before deciding to trade in financial instrument or cryptocurrencies you should be fully informed of the risks and costs associated with trading the financial markets, carefully consider your investment objectives, level of experience, and risk appetite, and seek professional advice where needed.
Fusion Media would like to remind you that the data contained in this website is not necessarily real-time nor accurate. The data and prices on the website are not necessarily provided by any market or exchange, but may be provided by market makers, and so prices may not be accurate and may differ from the actual price at any given market, meaning prices are indicative and not appropriate for trading purposes. Fusion Media and any provider of the data contained in this website will not accept liability for any loss or damage as a result of your trading, or your reliance on the information contained within this website.
It is prohibited to use, store, reproduce, display, modify, transmit or distribute the data contained in this website without the explicit prior written permission of Fusion Media and/or the data provider. All intellectual property rights are reserved by the providers and/or the exchange providing the data contained in this website.
Fusion Media may be compensated by the advertisers that appear on the website, based on your interaction with the advertisements or advertisers.
© 2007-2024 - Fusion Media Limited. All Rights Reserved.
