Utilities don’t get a lot of love from investors. They are the stodgiest of market sectors and tend to be purchased by the proverbial “widows and orphans” looking for a safe and reliable quarterly dividend check. And their sensitivity to interest rates makes them closer in behavior to bonds than more cyclical market sectors such as technology or industrials.
But it is precisely these qualities that can make utilities a critical piece of a market timing strategy—at least according to Pension Partner’s Charlie Bilello and Michael A. Gayed. Due to their “higher yield, lower beta, and relative insensitivity to cyclical behavior” the price action of utilities can tell you quite a bit about the direction of the broader market. In a strong market, utilities should underperform, all else equal, as their earnings are the least cyclically-tied to growth. But when investors are rotating into utilities, it can be a sign of trouble ahead.
Last year, I wrote a review of the book Intermarket Analysis and Investing, a remarkably insightful book by the late Michael E.S. Gayed, Michael A. Gayed’s father.
The elder Gayed attempted to put the pieces together and build a coherent process out of the hodgepodge—and often contradicting—schools of investment thought, which is something we all still struggle to do more than 20 years later. But the key insight from the book was Gayed’s observation that:
Market links are interrelated, and they tend to feed on each other
Relationships between asset classes can send signals as to the markets general direction and can, at times, call peaks and troughs.
This year, the younger Gayed took his father’s work a major step forward in the 2014 Charles H. Dow Award-winning paper An Intermarket Approach to Beta Rotation: The Strategy, Signal, and Power of Utilities, co-written with Charlie Bilello.
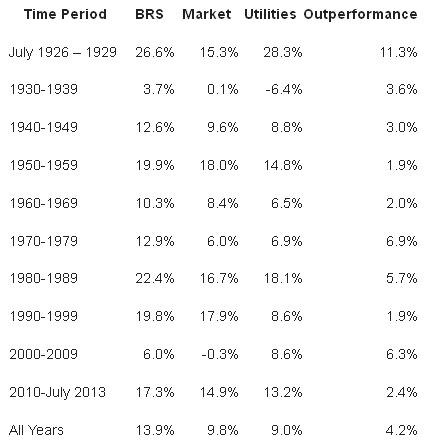
Bilello and Gayed build a simple, two-asset, Beta Rotation Strategy consisting of the utilities sector and the broader S&P 500. When utilities are outpacing the broader market, this is a signal to exit the S&P 500 and get defensive by allocating to utilities. When utilities are lagging—which would be the case more often than not during a healthy bull market—this is a signal to be invested in the broader market.
Getting into specifics,
When a price ratio (or the relative strength) of the Utilities sector to the broad market is positive over the prior 4-week period, position into Utilities for the following week. When a price ratio (or the relative strength) of the Utilities sector to the broad market is negative over the prior 4-week period, position into the broad market for the following week.
The basic rationale here is no different from other momentum and other trend-following strategies. Market movements aren’t completely random; they tend to follow trends based on any number of factors—relative valuation, Fed policy, earnings growth, etc.—until those trends have run their course.
So, how does the utilities-focused Beta Rotation Strategy perform? Actually, quite well. Bilello and Gayed back tested the strategy using data from 1926 to 2013, and the results are summarized below:

The usual caveats apply here. These are back-tested data that do not take into account trading expenses or taxes. And prior to the past 15 years, it would have been impossible to easily implement this strategy as there were few available index funds or ETFs that gave broad exposure to the utilities sector, such as the Utilities Select SPDR (XLU).
Furthermore, while the outperformance from the strategy were remarkably consistent over time, there are periods where virtually all momentum or relative-strength-based models will perform poorly. Relative strength models work best during long periods where the market is trending, either up or down. But during choppy, range-bound markets, relative-strength models tend to get whipsawed and underperform.
And finally, there is the issue of taxes. A strategy like Gayed and Bilello’s is best implemented in an IRA or other tax-deferred account, as a fair portion of the outperformance will be lost to short-term capital gains taxes in a fully taxable account.
I’d also like to see the authors run their models using other asset classes—such as REITs, mortgage REITs or MLPs—in place of utilities to see how the results compare. The correlation between utilities and the broader market is relatively low, but the correlations between these other asset classes and the S&P 500 are even lower.
But with all of that said, Bilello and Gayed’s Beta Rotation Strategy gives us some serious food for thought, particularly given that the broader markets are looking a little pricey. A relative strength model built along these lines will keep an investor positioned defensively during a major bear market.
Disclosure: Charles Lewis Sizemore, CFA, is the editor of Macro Trend Investor and chief investment officer of the investment firm Sizemore Capital Management.
