Get 40% Off
🚀 AI-picked stocks soar in May. PRFT is +55%—in just 16 days! Don’t miss June’s top picks.Unlock full list

S&P 500: Do Large Losses Lead To Further Losses?

Published 10/30/2018, 05:15 AM
US500
-

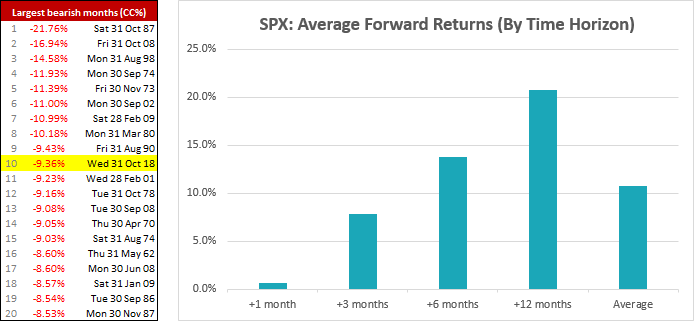
As of yesterdays close, the S&P 500 has shed -9.36% for the month of October. This puts it on track for its tenth most bearish month using data since 1960. Of course, with two trading days left in the month it could still make a comeback, but we don’t see the harm in getting ahead of the game and checking how things panned out for the other nine months.
SPX Average Foreward Return

Using the monthly close in percentage terms, we’ve looked at forward returns for bearish months >9.4%. The 1987 crash takes the top spot with an eye-watering 21.8% decline, but we’re more interested in seeing what happened after these key dates.

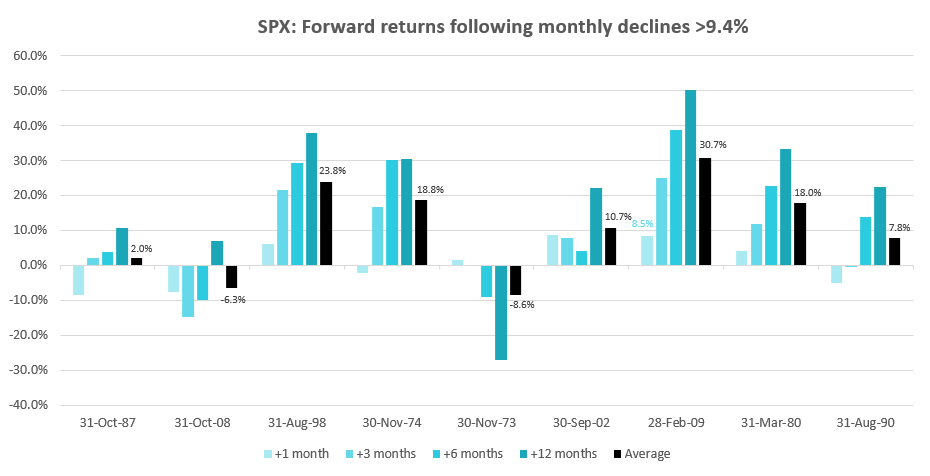
Encouragingly we see that, on average, returns were positive the following 1, 3, 6 and 12 months. Given the long-term upwards bias of the stock market perhaps positive returns 6-12 months out should not come as a major surprise, but it’s encouraging to see none the less. Breaking it down to individual periods shows the following month appears random (4 declines, 4 gains and a flat). Although it’s interesting to note that the 11% decline in February 2009 (7th most bearish) saw an 8.5% rebound the following month, which marked the swing low of the bear market.
SPX

Still, with such a small sample size we cannot say these numbers have statistical significance, but they are something to consider as price action and scare-mongering headlines unfold.
S&P 500

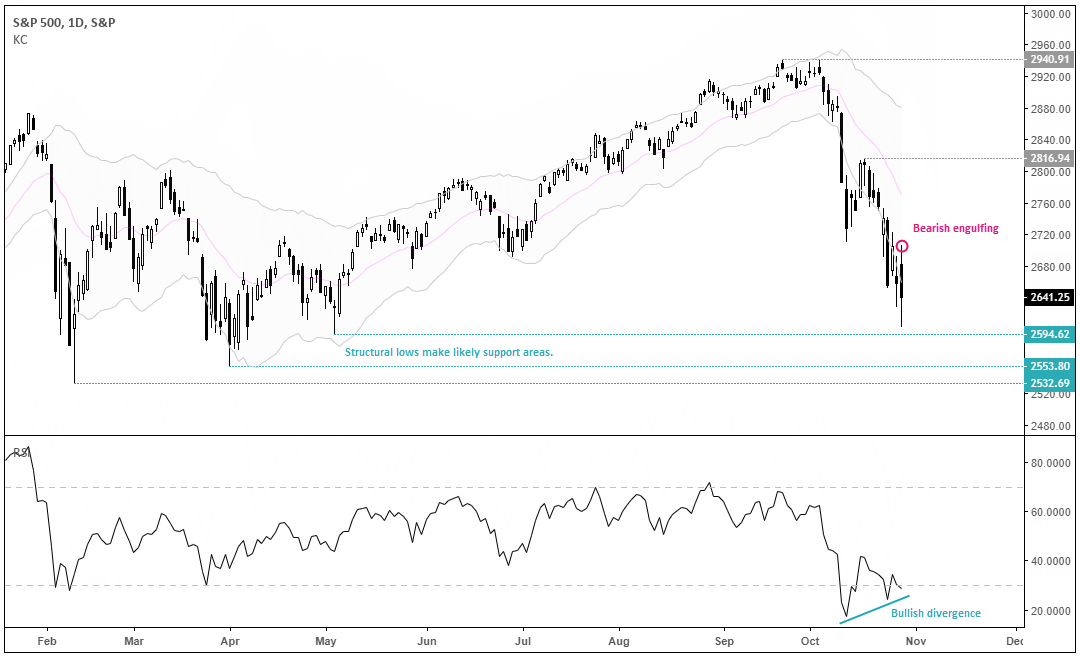
Looking at the daily chart of the S&P500 shows it could be approaching a technical juncture. Upon first glance, the trajectory of bearish momentum is hard to ignore, we see no immediate signs of a bottom and yesterday’s bearish engulfing candle shows bears continue to rule the roost. Yet, despite this gloomy first look, we see the potential for a bounce in due course. Prices are extended beneath the lower Keltner band, a bullish RSI divergence is forming in oversold territory and it trades within proximity to three structural lows. This makes the reward to risk profile undesirable for a short position and a likely area to tempt profit taking, potentially dragging prices higher in the process.

Original post

Latest comments

Loading next article…
Risk Disclosure: Trading in financial instruments and/or cryptocurrencies involves high risks including the risk of losing some, or all, of your investment amount, and may not be suitable for all investors. Prices of cryptocurrencies are extremely volatile and may be affected by external factors such as financial, regulatory or political events. Trading on margin increases the financial risks.
Before deciding to trade in financial instrument or cryptocurrencies you should be fully informed of the risks and costs associated with trading the financial markets, carefully consider your investment objectives, level of experience, and risk appetite, and seek professional advice where needed.
Fusion Media would like to remind you that the data contained in this website is not necessarily real-time nor accurate. The data and prices on the website are not necessarily provided by any market or exchange, but may be provided by market makers, and so prices may not be accurate and may differ from the actual price at any given market, meaning prices are indicative and not appropriate for trading purposes. Fusion Media and any provider of the data contained in this website will not accept liability for any loss or damage as a result of your trading, or your reliance on the information contained within this website.
It is prohibited to use, store, reproduce, display, modify, transmit or distribute the data contained in this website without the explicit prior written permission of Fusion Media and/or the data provider. All intellectual property rights are reserved by the providers and/or the exchange providing the data contained in this website.
Fusion Media may be compensated by the advertisers that appear on the website, based on your interaction with the advertisements or advertisers.
© 2007-2024 - Fusion Media Limited. All Rights Reserved.