Get 40% Off
🚨 Volatile Markets? Find Hidden Gems for Serious OutperformanceFind Stocks Now

Market Action Remains Healthy, But Clouds Hover On The Horizon

Published 06/18/2020, 11:25 AM
Updated 07/09/2023, 06:31 AM

You may ask whether the S&P 500 rebound has stalled, or is that just a healthy consolidation – to which I would reply that the market is merely digesting gains from its sharp upside reversal. In the battle of narratives, the corona second wave fears still play second fiddle to the recovery hopes, and especially the many programs that push for it. Can the aftermath of today's unemployment claims derail the unfolding stock upswing? Again, I don't think so.

Yes, I think that the grind higher in stocks remains on – sometimes slow, and sometimes not so slow.

S&P 500 in the Short-Run

Let’s start with the daily chart perspective (charts courtesy of http://stockcharts.com ):

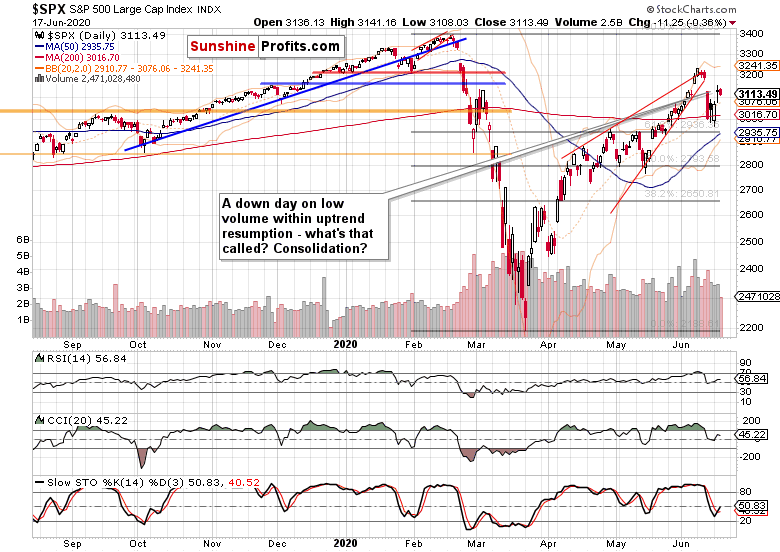
The stock bulls continue enjoying the upper hand, and yesterday's red candle doesn't really change that. The volume says there is no conviction in the drive for lower prices. True, it might look superficially convincing to the bears, especially coupled with Tuesday's upper knot.

But to me, this is just establishing a higher base after yet another decisive Fed move. Make no mistake, buying individual corporate bonds is huge – they can sit on the Fed's balance sheet for as long as the central bank wants them to. After the many instruments on their table already, this is just as close to buying stocks or their ETFs outright as it gets. By the way, Bank of Japan already does that, and the Fed might follow one day.

The daily indicators are positioned constructively for the stock upswing to continue – at this point, I am waving off concerns that they might show bearish divergences by making lower highs next. A pattern in progress is just that – not completed. And besides, the other considerations have the potential to overweigh that.

3rd party Ad. Not an offer or recommendation by Investing.com. See disclosure here or remove ads .

Look how far the bears got with the bearish wedge breakout invalidation and the island top reversal – the consequences have overwhelmingly played out already. True, we're in the summer doldrums for stocks – and I earlier called for quite some sideways trading over these month. I continue to think that this would serve just to build a strong base, a launch pad if you will, to catapult stocks higher when they're ready for such a move.

These were my points yesterday about the momentum:

"(…) The speed with which prices cleared the 61.8% Fibonacci retracement, is lending credibility to the bull market thesis. It's not unexpected that a sharp plunge of Thursday's caliber gives way to a brief consolidation that attempts to move the market either way, eventually followed by similarly sharp rebound. That's a fitting description of what we have seen on Monday and yesterday."

But how come the overnight S&P 500 price action still has the downside flavor to it?

To answer: the risk-off bias continued throughout the Asian session. China's central bank reverse repo rate cut was overshadowed by poor Australia jobs data.

In light of the above, it's encouraging to see that the S&P 500 recouped its overnight losses. Encouraging and not at all unexpected, that is. The technicals remain arrayed behind the stock bulls.

Moving back below the 3100 mark in the runup to the unemployment claims, doesn't change that. I think that the market will yet again shake off another 1,000K+ figure, and focus on its interpretation of the overall jobless claims trajectory and way less than bad Philly Fed Manufacturing data during the regular trading session.

3rd party Ad. Not an offer or recommendation by Investing.com. See disclosure here or remove ads .

What would the credit markets say to my bullishly leaning opinion?

The Credit Markets’ Point of View

iBOXX High-Yield Corp Debt

High yield corporate bonds (NYSE:HYG) moved lower yesterday, but what about the volume? Who would trust such a low one to base one's short- or medium-term trading decisions on it?

Take a look instead at the sizable early April gap and the trading action that followed next. There were some downside moves, yet amid generally rising stocks. And what about the mid-May non-confirmation as the HYG ETF moved lower while stocks more than held ground? While we're not at such an advanced stage of Monday's Fed move digestion, it pays to remember that lesson already.

IBOXX HY Corp Debt Vs 1-3Y Tsys

A picture speaks a thousand words – high yield corporate bonds to short-term Treasuries (NASDAQ:SHY) are indeed getting a bit ahead of stocks in their downside move. While we're at the opening phase of absorbing the Fed's decision, I continue to think this will serve well the higher base-building efforts that would launch stocks higher in the future. I certainly don't think we're rolling over to a new bear market with power to approach the March lows.

iShares 3-7Y Tsy ETF

The short-term Treasuries' chart (NASDAQ:IEI) isn't breaking to new highs, which would indicate strong risk-off sentiment. This assessment is more pronounced when looking at long-dated Treasuries (NASDAQ:TLT), and can be reasonably applied to the very short-term ones (SHY) too.

In short, the bond markets aren't questioning the recovery storyline, and are still more sensitive to the money spigots than hair-raising corona stories. I'm not arguing for a V-shaped recovery here, I just think that "less bad" is the new "good", as stocks are bought amid the prevailing real economy uncertainties (just when and how much will it rebound with some veracity?) and stimulus efforts as far as eye can see.

3rd party Ad. Not an offer or recommendation by Investing.com. See disclosure here or remove ads .

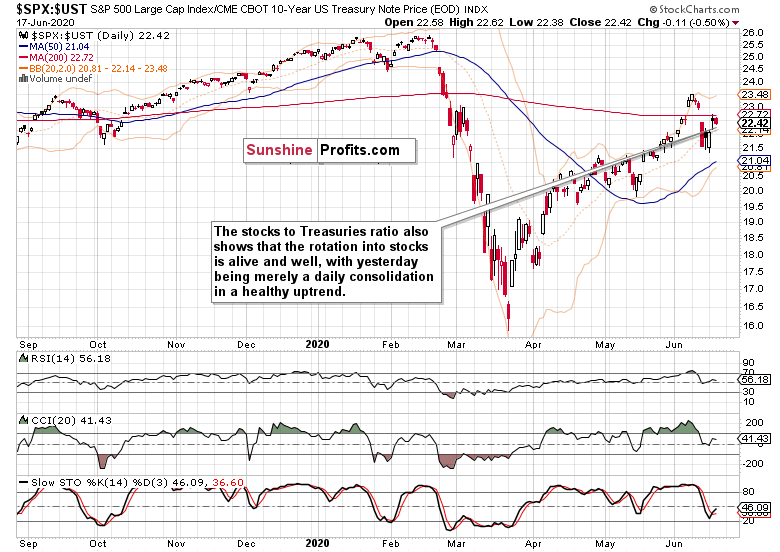
The stocks to Treasuries (SPX:UST) ratio confirms the above, revealing that we're still in an uptrend. In other words, the stock bull run has legs, and all we're witnessing is a short-term consolidation after the ratio got taken down a peg or two on Thursday.

Needless to say, the action remains healthy, despite the many clouds on the horizon, and I think it'll translate into what bull markets do – they keep climbing a wall of worry.

From the Readers' Mailbag

Q: Market correction lasts 3 days? And bear market lasts one month? That's definitely something new for market. Some people say that this time it's different.

A: If you look carefully at the April and May downswings, that has actually been the case precisely. Sideways trading if not an outright upswing breaking above previous local highs, is what followed. I've been saying that market action which decades ago took months or weeks, takes weeks or days in our era. With our markets being increasingly AI-driven, the everlasting human emotions of fear and greed are taking a shorter path in being reflected in prices.

A bear market that shaves off almost 40% of the S&P 500 value in six weeks? It just happened, and we're in a bull market now. Or can you show me a single instance of when stocks overcame the 61.8% Fibonacci retracement off their lows only to plunge below them later again, apart from the post-WWII bear market? There is none.

Summary

Despite yesterday's pause, the risk-on sentiment appears set to return as the credit markets keep discounting Monday's Fed move, and are actually non-confirming the stock upswing on a very short-term basis. But we've seen similar behavior with the April $2.3T bombshell already, which is why the S&P 500 has a solid chance of extending gains down the road. Treasury yields aren't questioning the rebound story as buy-the-dip mentality in stocks keeps having the upper hand regardless of the perils and uncertainties.

3rd party Ad. Not an offer or recommendation by Investing.com. See disclosure here or remove ads .

Latest comments

Excellent article with objective analysis! Totally agree.
Monica, thank you for another objective analysis. I have been buying the dips and this had worked well so far. I encode and develop my own technical indicators, but frankly I am mostly paying attention to the "money spigot" rather than the technicals and fundamentals. What indicator do you use to watch the spigot?
Thank you. I'm laying out the case daily for what I think and why the market will do likely next - i.e. the market odds. You see that I pay attention to the technicals and fundamentals, crafting the story of market moves. A humble advice - it's quite often the case that the run-of-the-mill indicators work better or just as well (it's just how you use them) than (the danger here is that) overly optimized indicators for (brief?) in-sample data with too little out-of-sample verification
Thank you for the reply, what I am looking for is not a technical tool... These things work best when there is less market interventions. The interventions tend to skew most indicators off to the point they become useless at times. The charts almost become engineered. This is frankly why I pay attention to your work because you take into consideration the outside forces that tend to influence the market.
Thank you, there's really no other way to take into consideration all that's happening around, and using judgement
The market is no longer a rational market where price discovery is relevant. The current market is controlled by the few as their algorithms can think and trade faster than any TA ever will...you currently have the Bull vs Bear thesis being fought out by the Few...as the alto's continue to force the bears into pain...but until the pain becomes unbearable the Bull altos will continue to push this higher...and with Jerome at their beck and call the downside is limited..
Please find your question answered in today's article, just next to Cornel Pod's one.
Thanks Robert Dziadkowiec, Pa Ag, Senor dos Santos, and everyone else - I am delighted that I can contribute something meaningful and enlightening to you (great honor to hear your point, Senor dos Santos - I apologize for non-capitalized spelling of senor, I'm not all that good at Spanish). Approaching the markets humbly despite my oh-so-often very clear tone (thank you, Pa Ag). Thanks for everyone's thoughts that I'll keep on addressing directly within comments, or within the analyses implicitly
Excellent analysis! Thx. One concern I have is the bear wedge pattern that everyone uses including yourself. By looking at $SPX closing values I am able to produce a rising channel with parallel lines (28 degress, 29 degrees) for upper and lower trendlines. The are NOT broken at this point altough there were multiple tests. Switch to line mode instead of candles. All the indices show this pattern and their ETF's.
Thank you for the continuing comments and appreciation! I plan to address your comment in today's article (if it doesn't make it over here just like my yesterday's answer to another commenter didn't, you'll find it on my home site)
interesting article
Until the FAANMG stocks show a down turn, market is not going be down..It does notnmatter what technical analysis show. The 5 big Tech giants have to go down for market to hit lower Fib levels.
Please find your question answered in today's article as well.
wall of worry? there is no worry. everyone is bullish.. pushing cash in..40,000 by Christmas. can't lose.
Excellent piece. Love your HYG angle. You are a true student of the Markets 👍👍📈
Very well Senhora Kingsley. I'm finding it interesting to read your predictions, independently of whether I agree with them or not.
So you know more than Warren Buffet he quoted today that the shorts are not about to get paid??
Are about to**
Interesting news, do you have the link?
The fact that the train left the station does not mean that there won't be another train, it just means that the travellers will have to wait a few more years for the next train. Till then enjoy the bull that started last april. 2009 repeating.
Analyze manipulated stock prices is senseless especially with behavioral finance tools. Just ask FED - an institution that is ought to make its decision and doings public and you know where prices are and where will go.
Slowly? You are an insane person.
The fed was giving the banks 40 billion a day last month at 0% interest and what would you do if you were a bank getting free money, buy stocks of course. They stopped for 1 day on June 10th and we had a 5% pullback (which was a perfect time to get back in) now from 6/11 to 7/11 the fed will be giving the banks 4 billion a day at .25% interest, of course we'll move sideways, with a float up till 7/11 after that it's business as usual as long as everything opens back up again.
that's 0.25% interest
There's warming signs cropping up such as the IWM:$OEX ratio which is breaking down similar to what happened in early May before a big plunge in equities.
Fed buys corp. debt, corporations get more indebted while at the same time their earnings drop. Outcome: stonks should rise. Do I miss something, apart from a degree in economics?
Risk Disclosure: Trading in financial instruments and/or cryptocurrencies involves high risks including the risk of losing some, or all, of your investment amount, and may not be suitable for all investors. Prices of cryptocurrencies are extremely volatile and may be affected by external factors such as financial, regulatory or political events. Trading on margin increases the financial risks.
Before deciding to trade in financial instrument or cryptocurrencies you should be fully informed of the risks and costs associated with trading the financial markets, carefully consider your investment objectives, level of experience, and risk appetite, and seek professional advice where needed.
Fusion Media would like to remind you that the data contained in this website is not necessarily real-time nor accurate. The data and prices on the website are not necessarily provided by any market or exchange, but may be provided by market makers, and so prices may not be accurate and may differ from the actual price at any given market, meaning prices are indicative and not appropriate for trading purposes. Fusion Media and any provider of the data contained in this website will not accept liability for any loss or damage as a result of your trading, or your reliance on the information contained within this website.
It is prohibited to use, store, reproduce, display, modify, transmit or distribute the data contained in this website without the explicit prior written permission of Fusion Media and/or the data provider. All intellectual property rights are reserved by the providers and/or the exchange providing the data contained in this website.
Fusion Media may be compensated by the advertisers that appear on the website, based on your interaction with the advertisements or advertisers.
© 2007-2024 - Fusion Media Limited. All Rights Reserved.