
If you wonder why the Japanese yen keeps performing so solidly this week, look no further than the behavior in fixed income markets around the globe, where bond yields are getting absolutely destroyed. Not only the US yield curve has inverted, but other milestones are also happening before our eyes, such as the German 10-year anchored in negative territory, the Aussie 3-year bond yields making historic lows, and the list goes on. Amid such an aberration, especially when it gets compared with the high valuations in equities (an epic departure from normal correlations), many are starting to question that such divergence between bonds yields and equities can’t last forever. So, this week, and without setting precedent, it looks as though the disorderly movements in bonds (remember historically low vol tends to lead to expansions in vol), equities traders are finally taking notice. Economics 101 suggests that when yields are this low, aside from the eternal debate of whether or not the US yield curve will lead to a domestic economic recession, it’s a clear communication that the market is not buying into the rhetoric that the future is bright but the opposite, it’s telling us that a gloomy outlook is being discounted by the high concentration of long-dated bond maturities as a good enough yield that acts as a safe-haven vehicle.
Currency Strength Meter
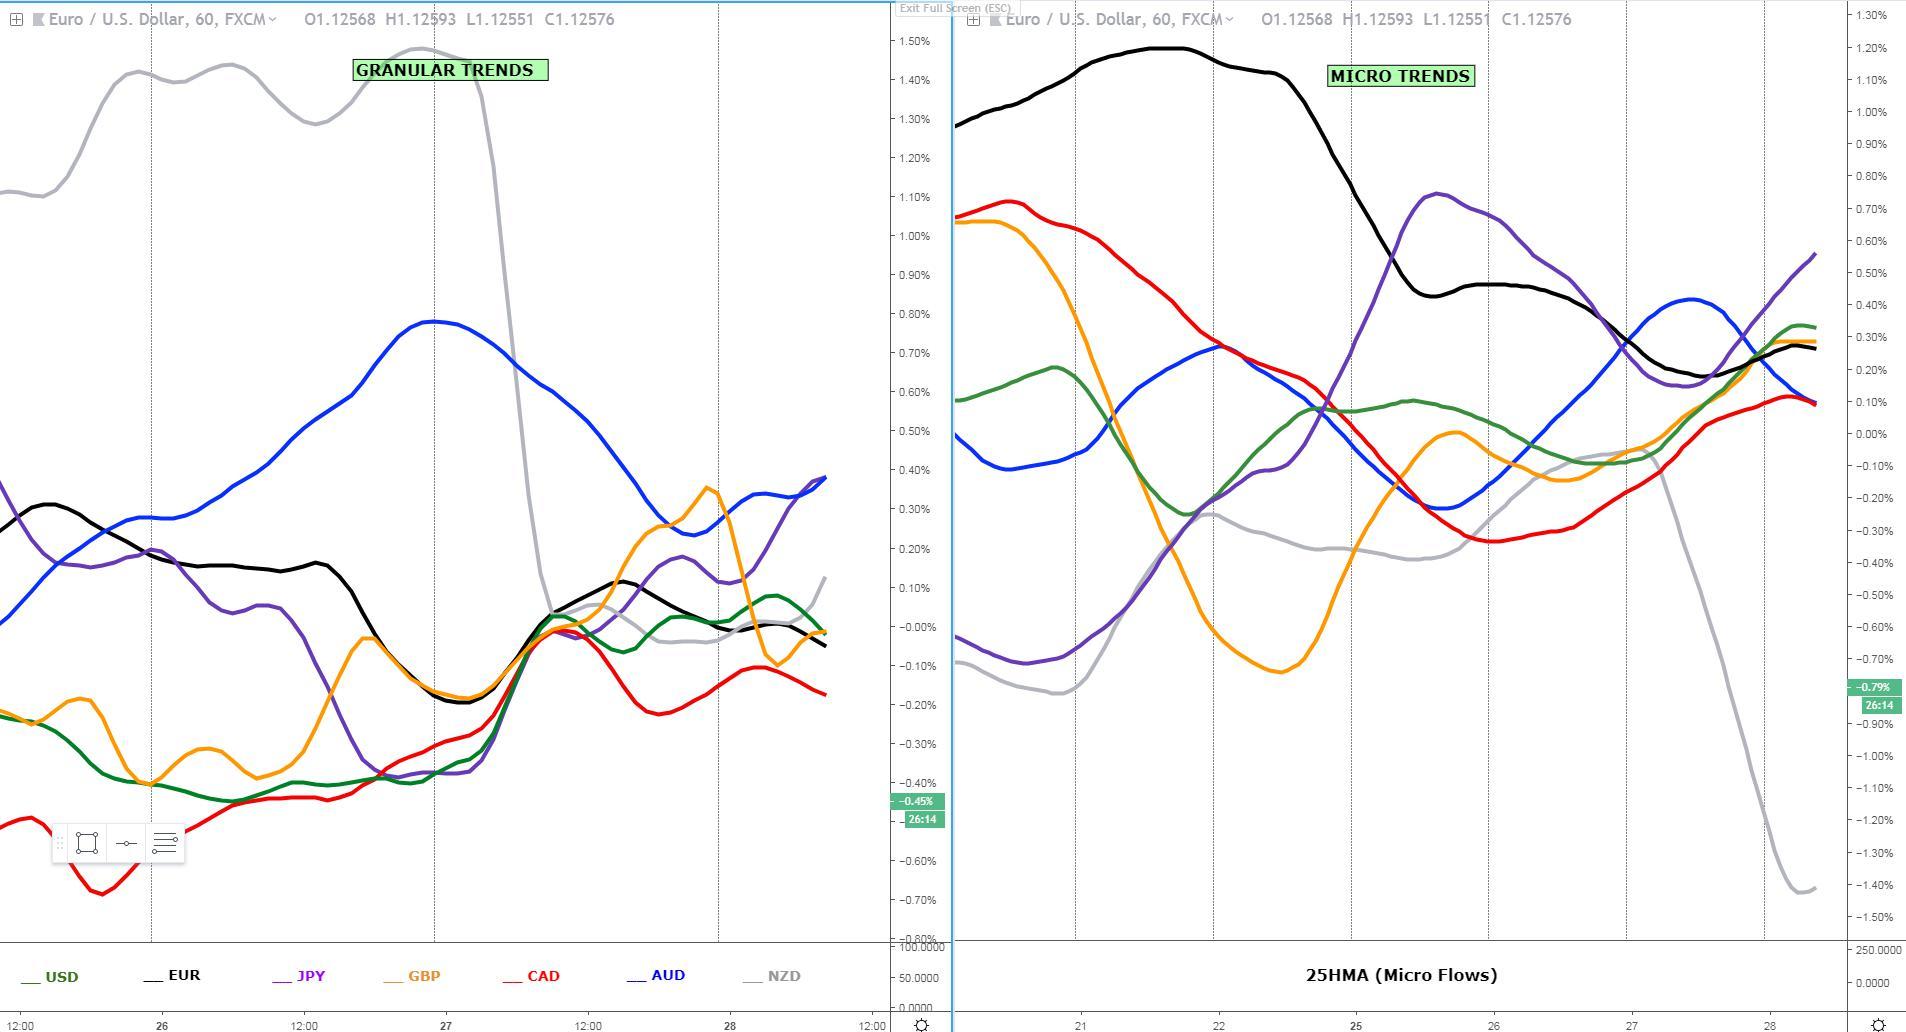
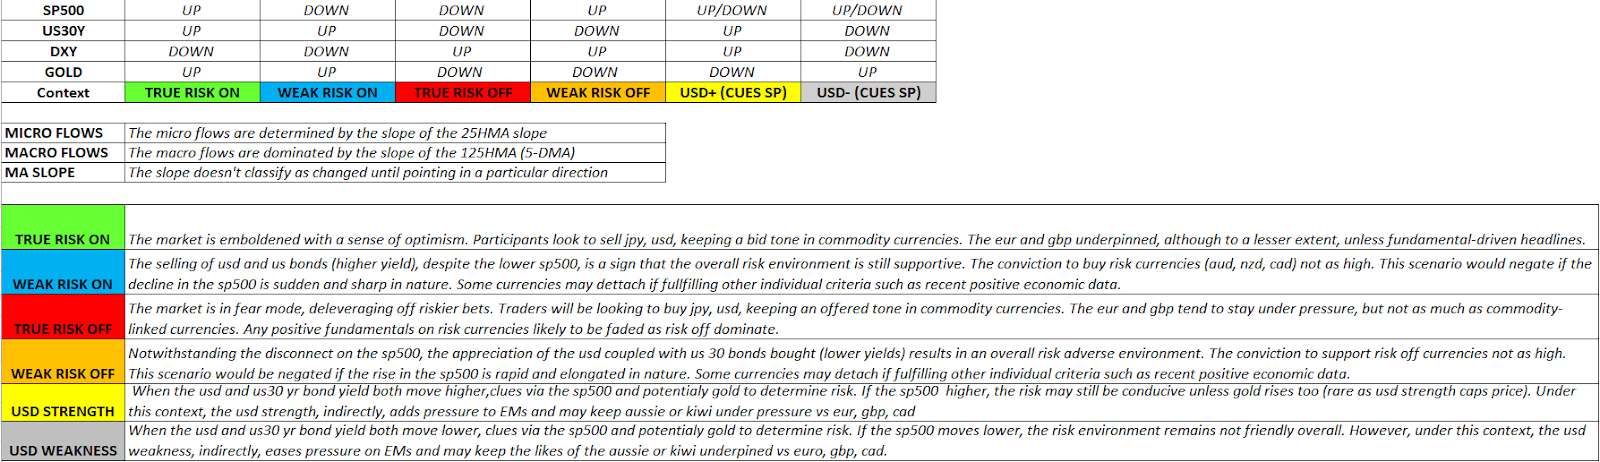
RORO - Risk On Risk Off Conditions
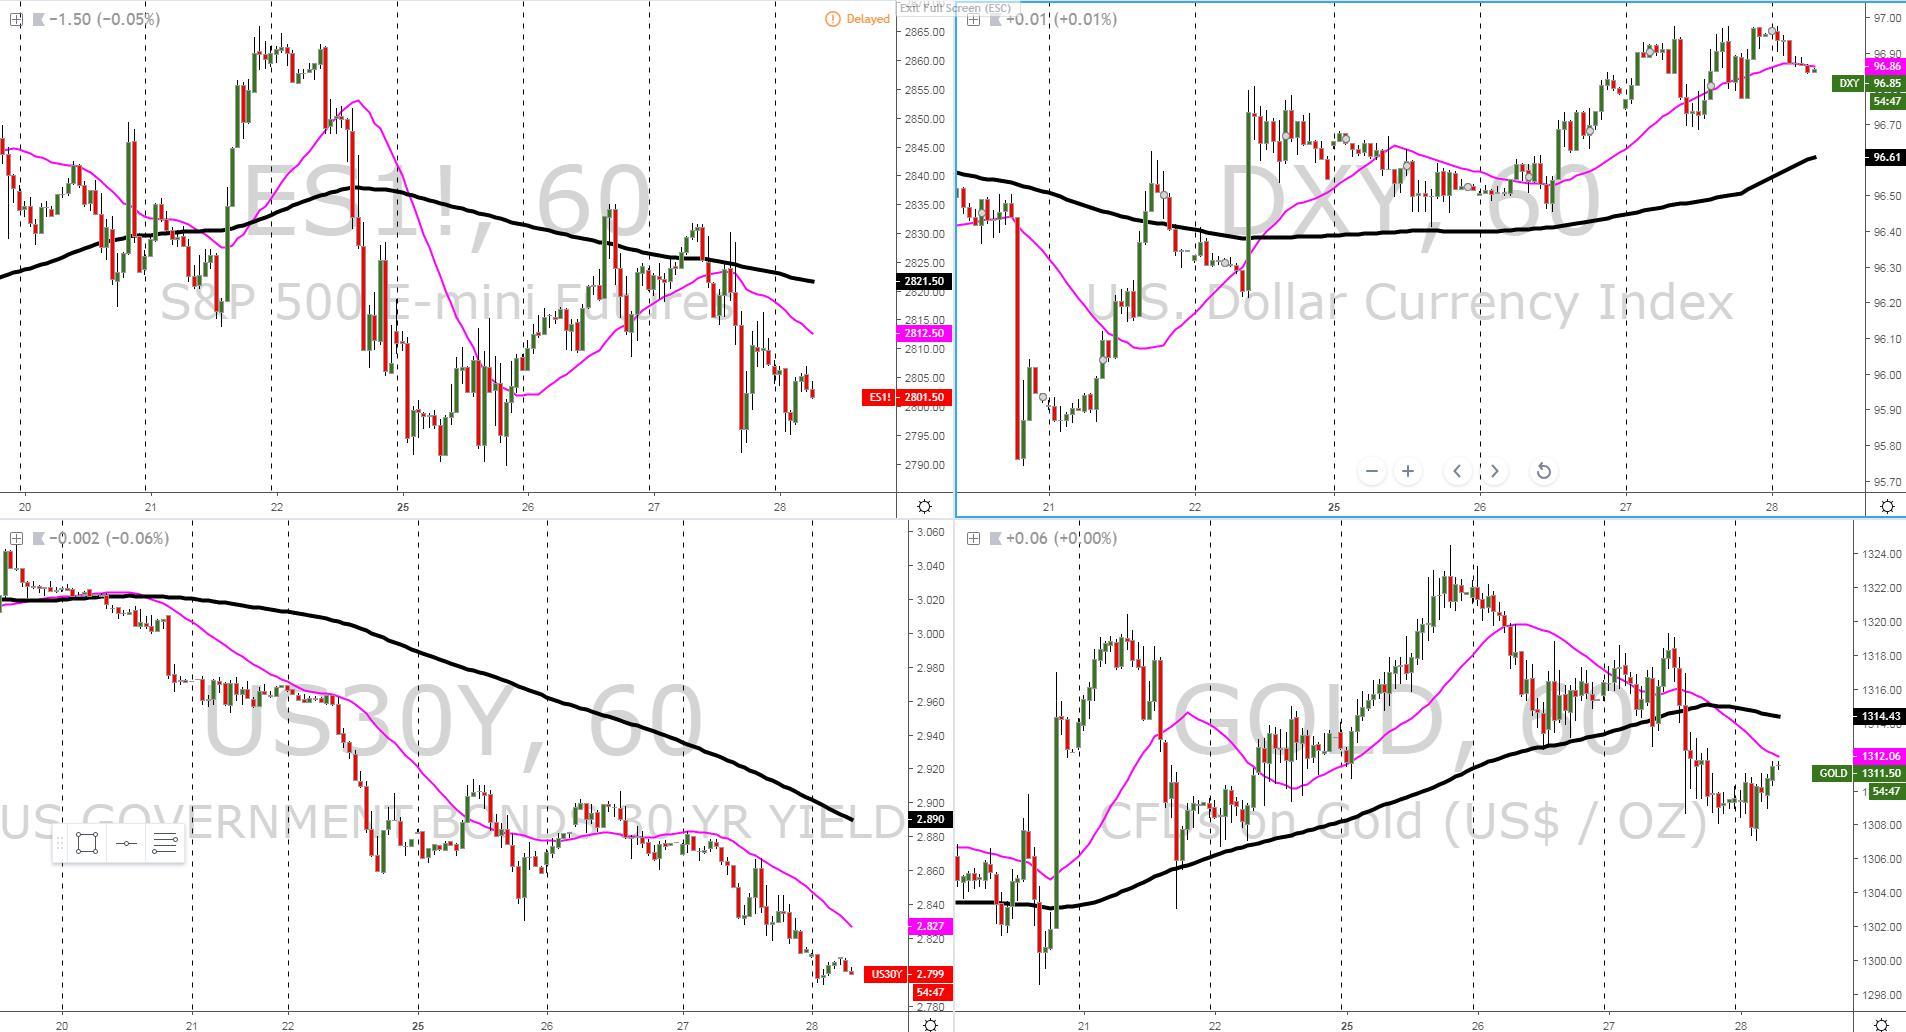
As the charts above demonstrate, the risk-off conditions are well and alive. US equities are finding a new wave of committed sellers ever since the top found at 2,865.00, US yields are marching to the tune of its own drummers as the epic divergence with equities expands even further, while the DXY is still finding sufficient levels of interest to be bought even if the moves are far from earth-shattering. What’s interesting, however, is that amid such deterioration in the risk environment, gold has been sold off quite hard, if only by the low vol standards we’ve been used to for quite some time now.
Summary: Intermarket Flows & Technical Analysis
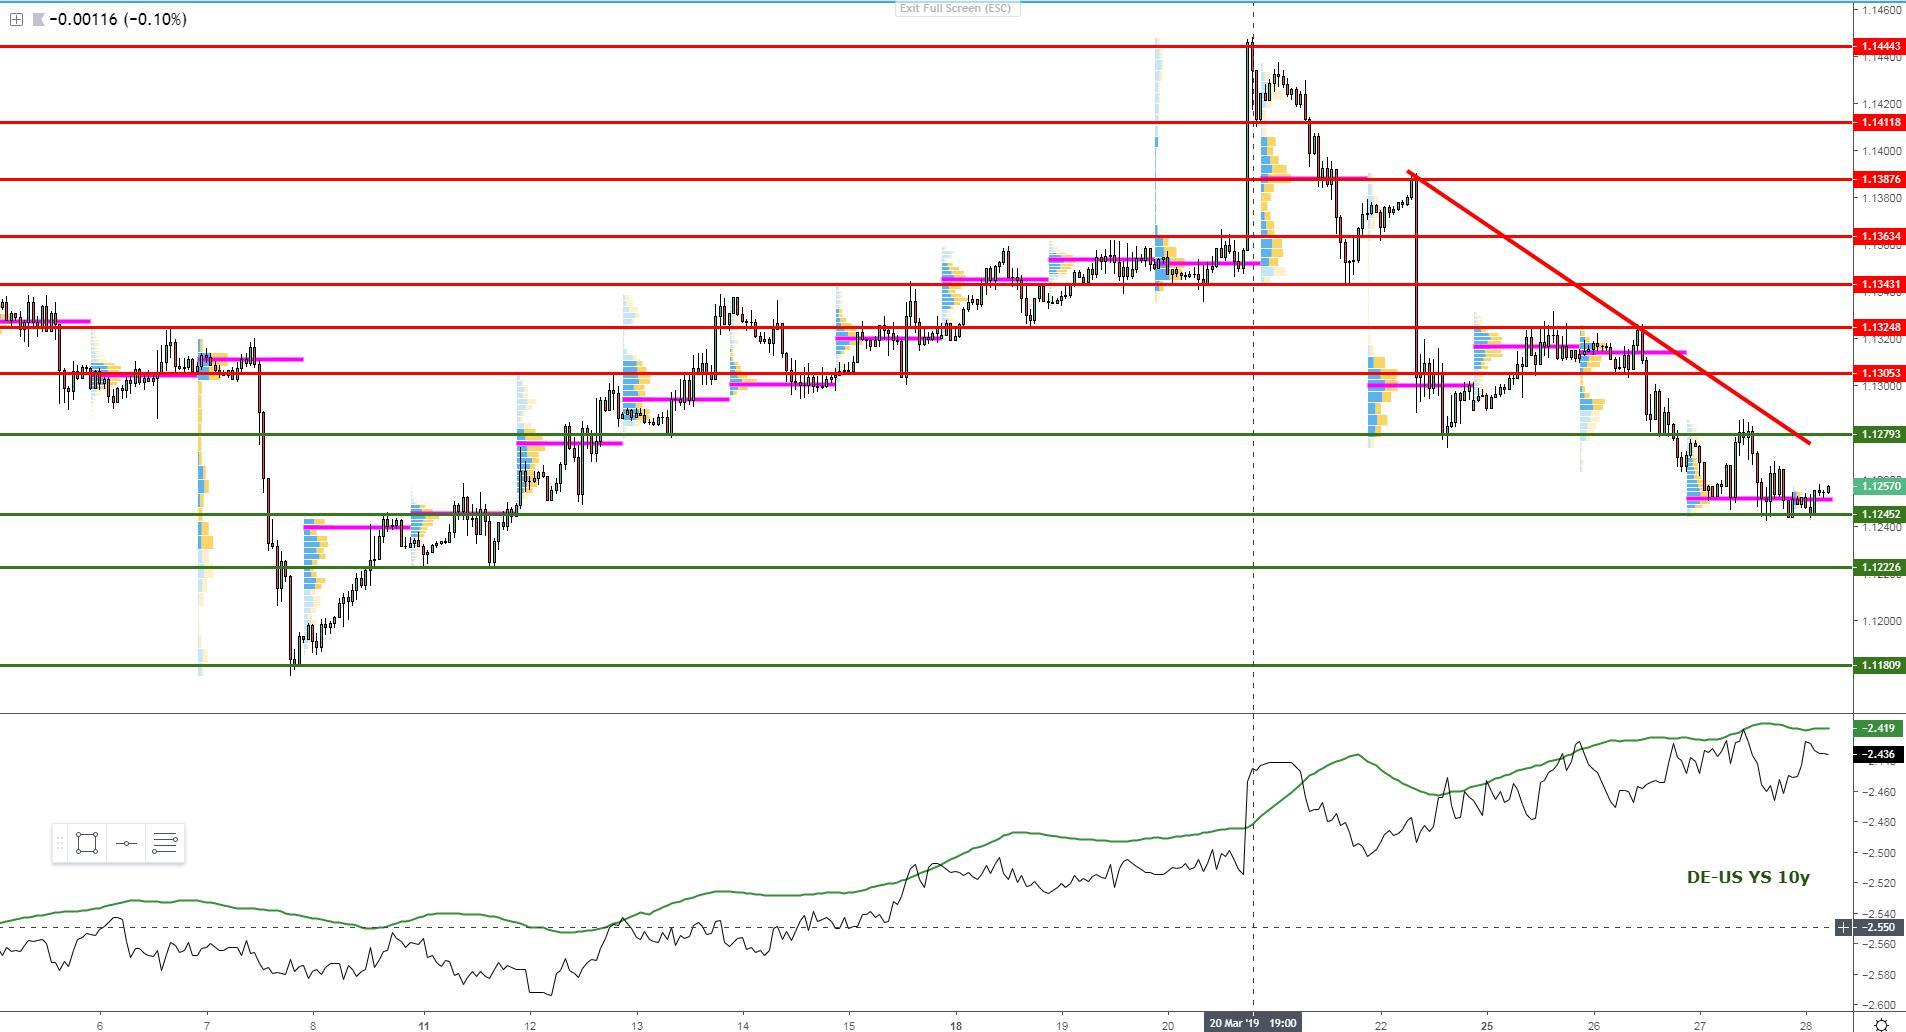
EUR/USD: Finds Bottom Pickers Sub 1.1250
The rout in global bond yields has been pronounced, with US fixed income drawing the most interest, which has resulted in the yield spread advantage vs the Germans to take a hit. In yesterday’s thesis, I mentioned that the reduction in the US vs German yield spread was a key reason why it’d be difficult to sustain prolonged periods of the selloff in this market. Looking at Wed’s price action, the formation of an L-shaped volume profile with up to 4 different failed attempts to break through 1.1250 reflects precisely this argument. That said, sellers are still in control as the price consolidates at the lows of the ongoing hourly trend, with a descending trendline still guiding us lower.
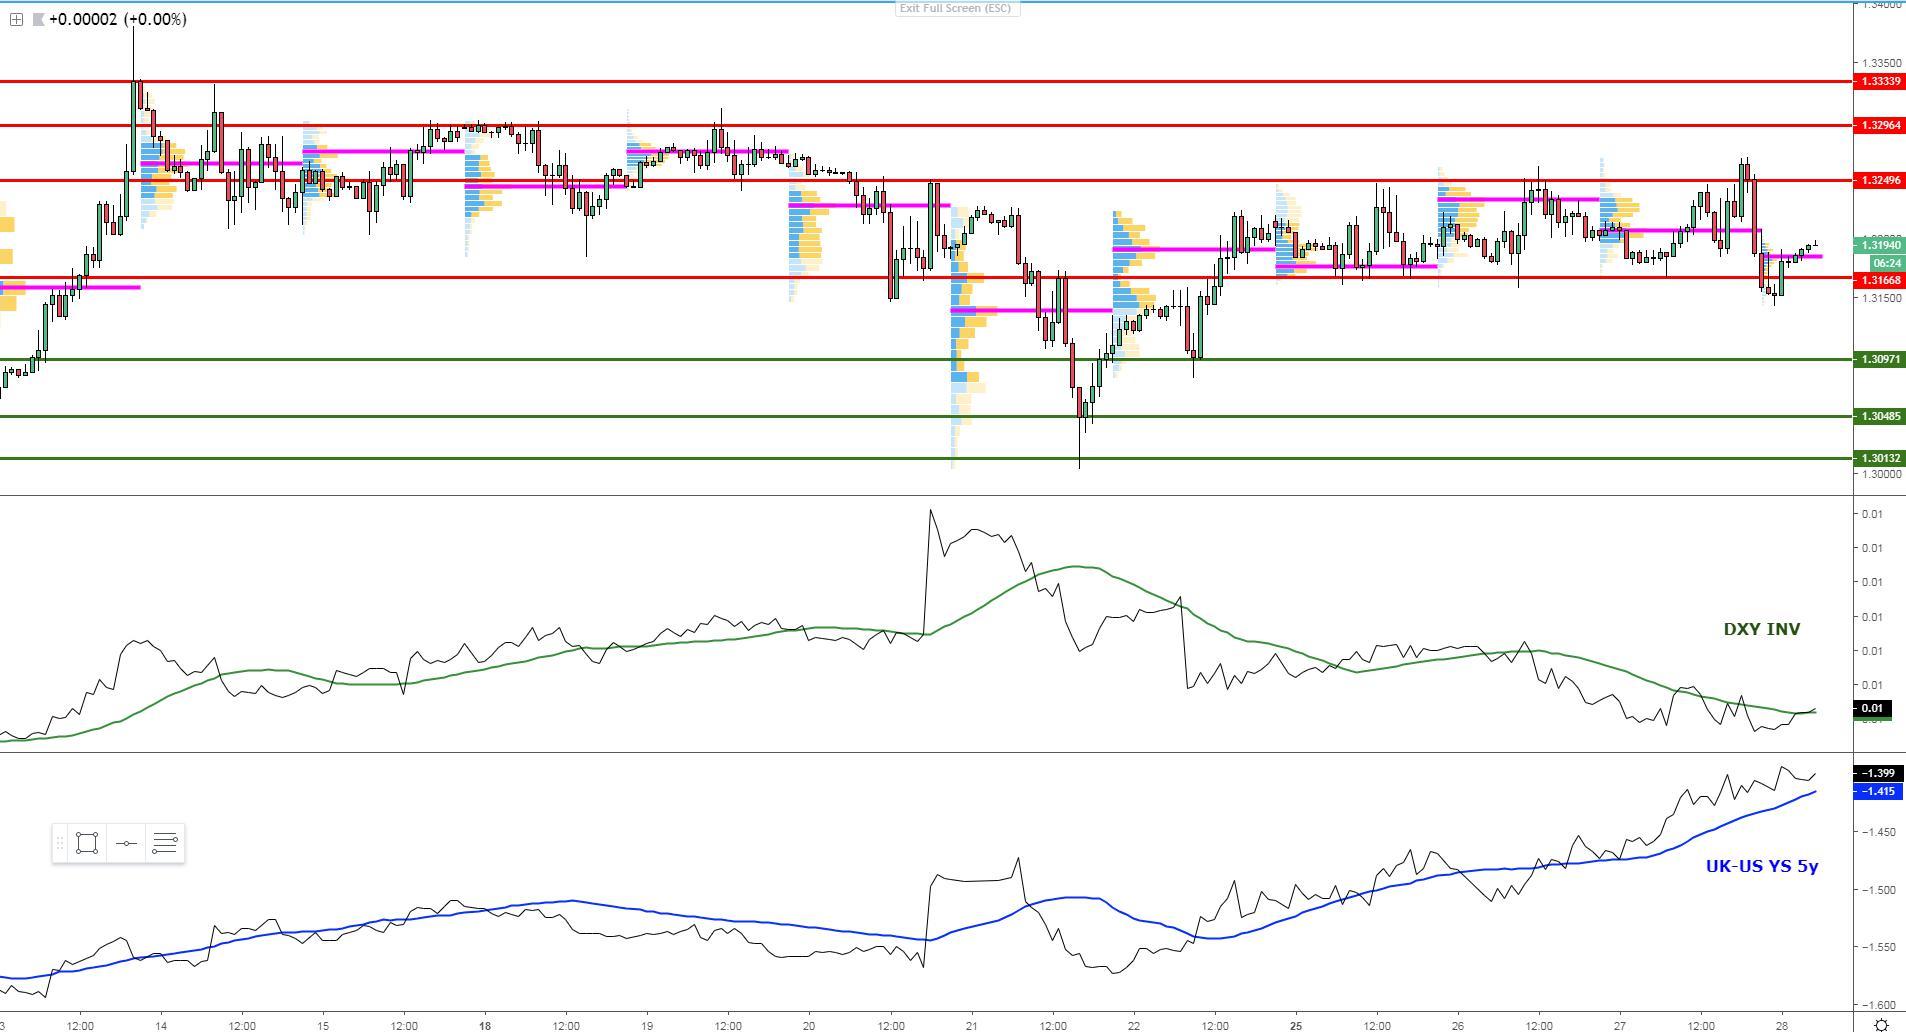
GBP/USD: Rotational Profile Remains The Norm
The state of trappy and directionless price action, if Wednesday serves as an indication, looks set to extend until we can clear up the Brexit situation. The parliament in the UK continues to find no consensus in what’s the way out of this mess and that’s translated in Yo-Yo type rotational conditions, with the GBP fading breakouts of the range in both directions. By the end of trading on Wed, the volume profile exhibits another single distribution day with little value being built at the extremes, which yet again, constitutes a recipe for erratic gyrations. Remember, this market remains headline driven now more than ever as we’ve entered the peak noise period in the Brexit saga. If we take the UK-US bond yield spread as our reference, buying weakness still makes a lot of sense given last week’s uptrend, while the DXY suggests the opposite. A complicated puzzle to resolve.
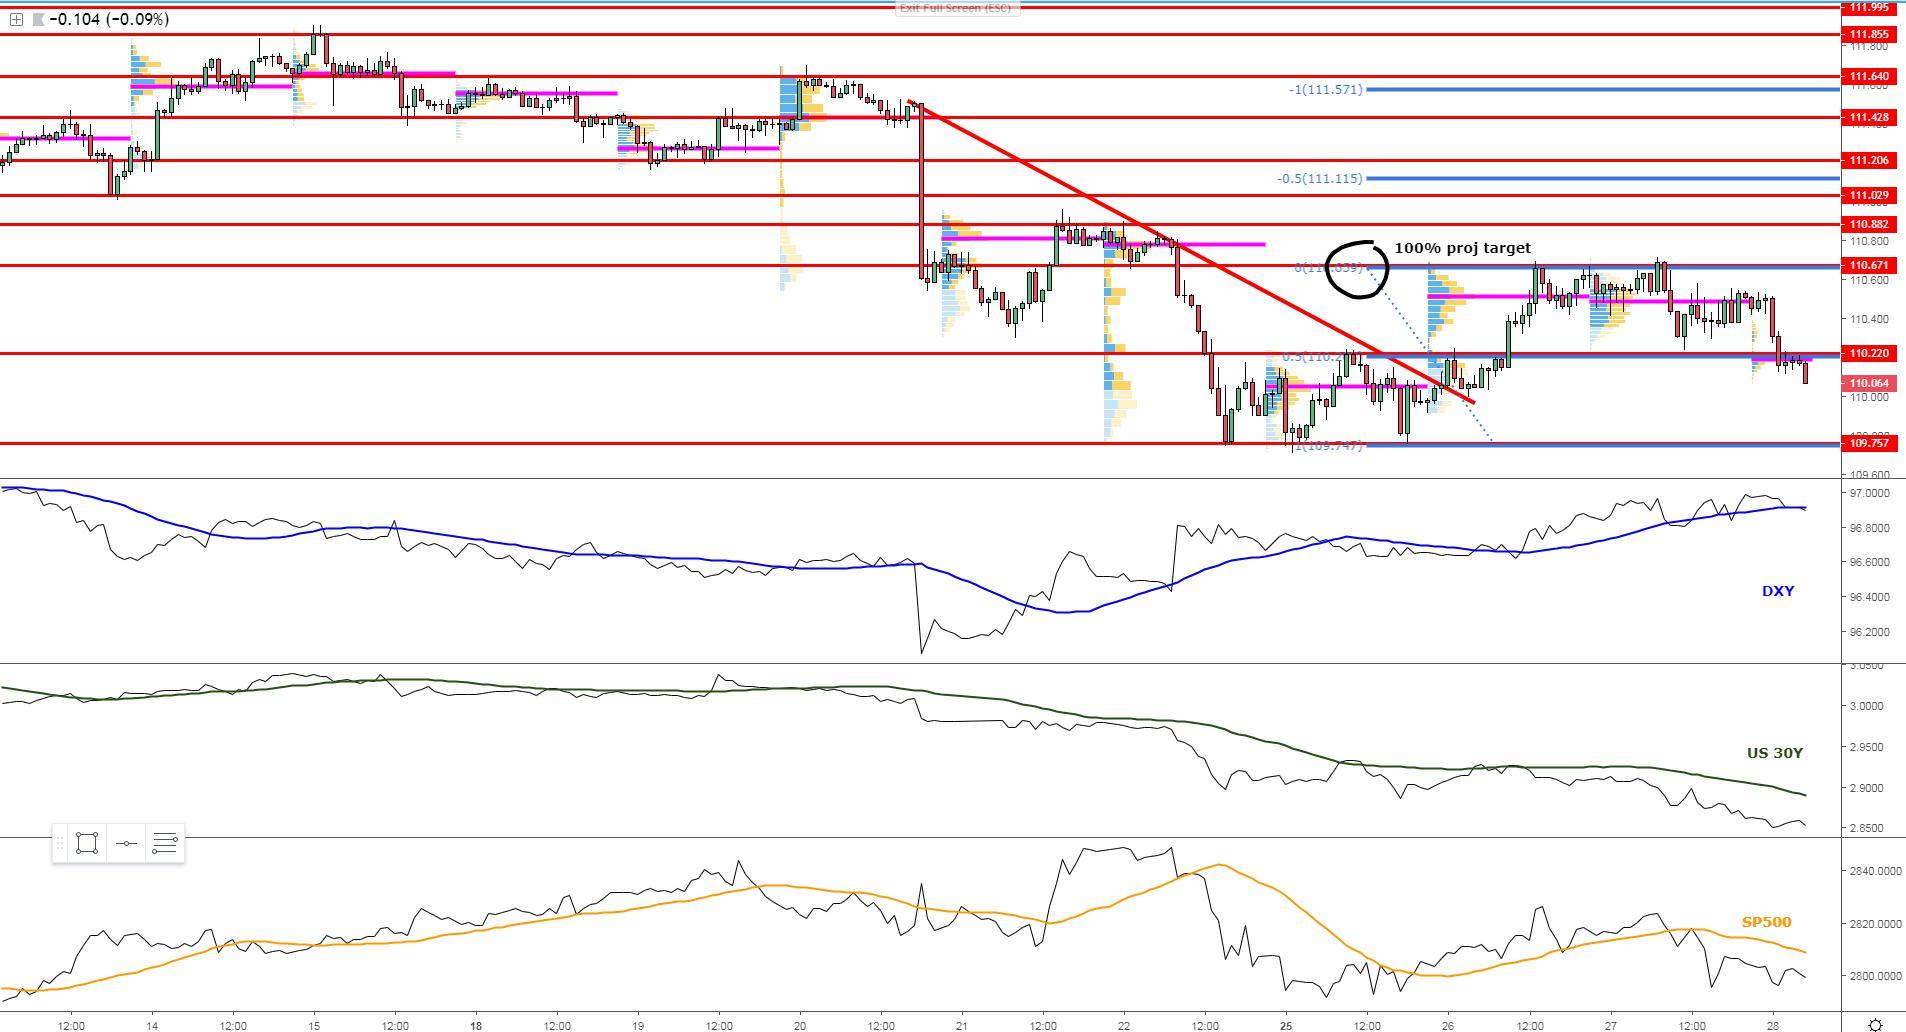
USD/JPY: ‘True Risk Off’ Adds Downward Pressure
The Japanese yen is drawing the most buy-side interest amid the ‘true risk off’ conditions, where the hammering of US yields, alongside the weakness in US equities, is taking its toll on the appeal to stay involved in long-side business in this exchange rate. The fact that the DXY is failing to make much headway even in such a risk-averse environment, is only exacerbating the limited interest to be a buyer. With 110.00 within sight, expect the next target of 109.75 (trend lows) to be retested. Should the dynamics not revert back to a more constructive risk environment, the trend is your friend here.
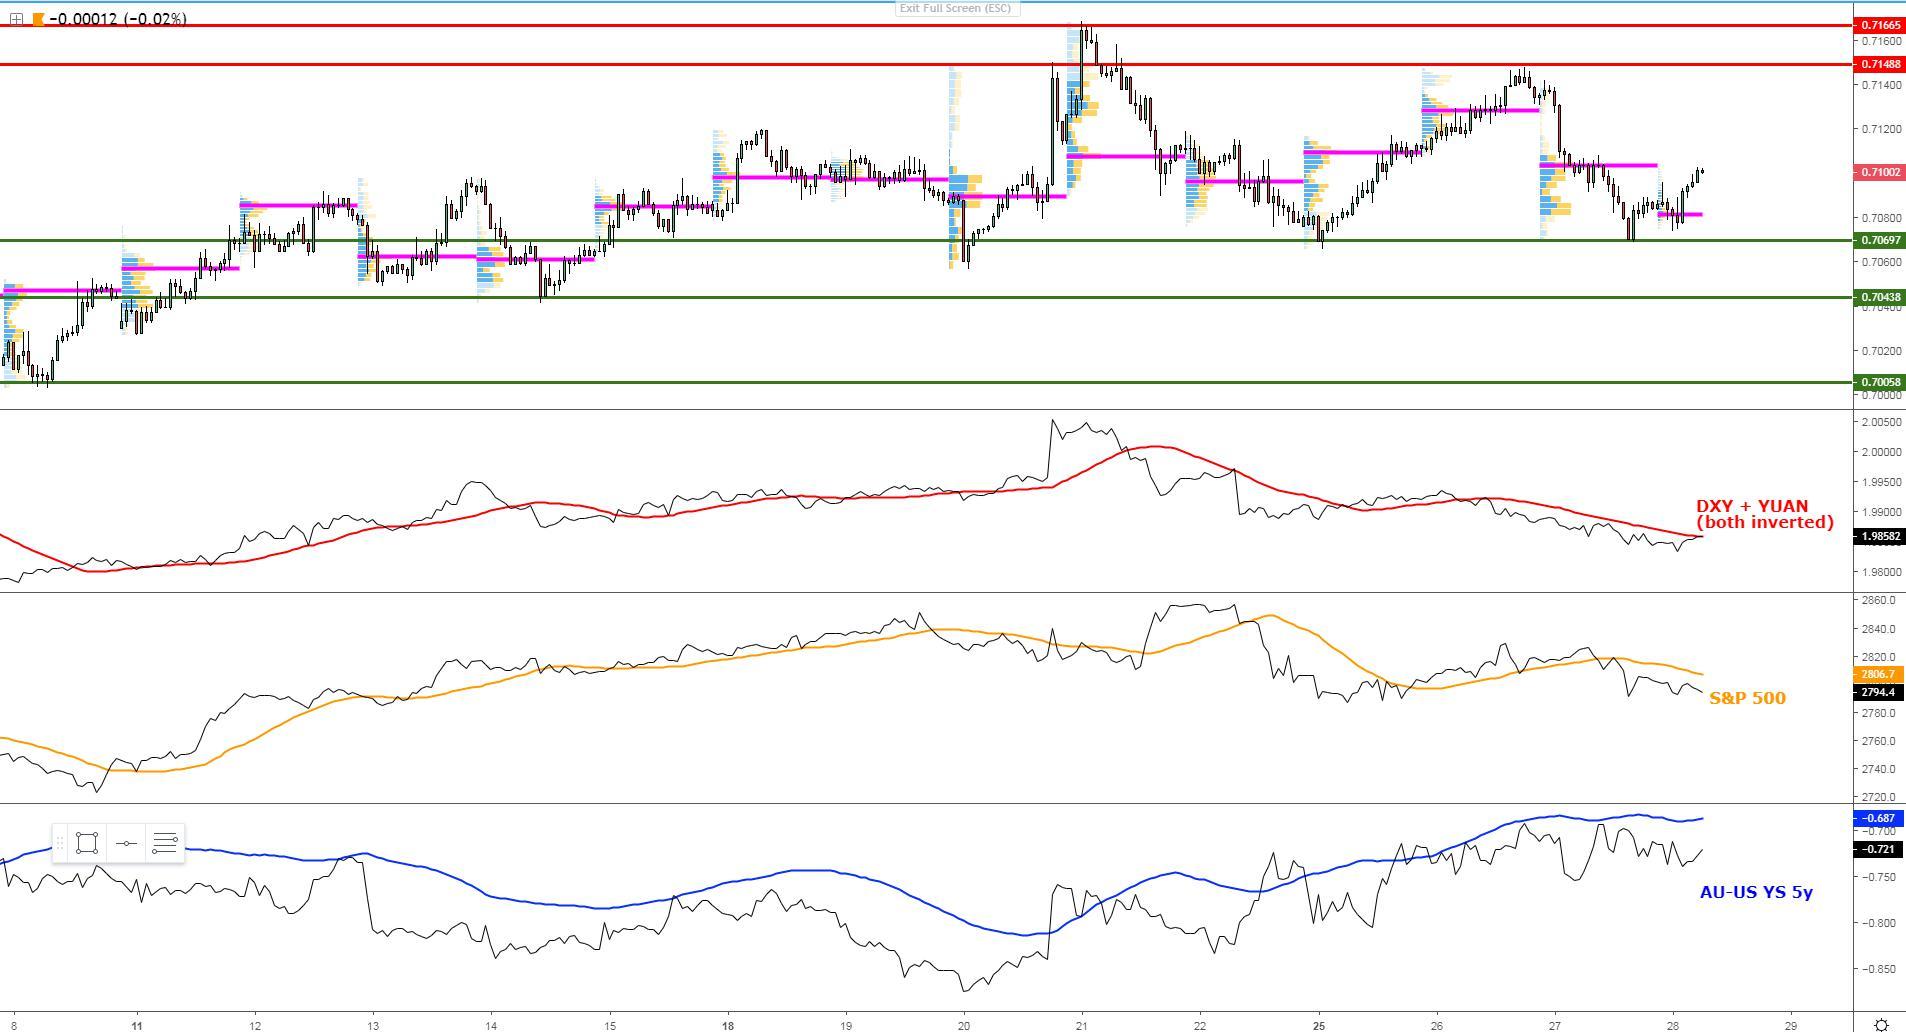
AUD/USD: Range-Bound Conditions, Catalysts Needed
The selloff in the AUD on the aftermath of the dovish turnaround by the RBNZ was a precursor of a market that is getting nervous about the new easing outlook in New Zealand will add further pressure for the RBA to adopt a similar approach and eventually cut rates as the market is pricing. The selloff, however, continues to find stubborn buying interest sub 0.7070 since March 15th, and yesterday’s price action was no exception, leading to a rebound towards 71c and in the process, it reinforces the notion that this is an exchange rate with little life to see the light outside its compressed 7150-7070 tunnel (range) until new fundamental catalysts do stimulate a new narrative.
Important Footnotes
- Risk model: The fact that financial markets have become so intertwined and dynamic makes it essential to stay constantly in tune with market conditions and adapt to new environments. This prop model will assist you to gauge the context that you are trading so that you can significantly reduce the downside risks. To understand the principles applied in the assessment of this model, refer to the tutorial How to Unpack Risk Sentiment Profiles
- Cycles: Markets evolve in cycles followed by a period of distribution and/or accumulation. The weekly cycles are highlighted in red, blue refers to the daily, while the black lines represent the hourly cycles. To understand the principles applied in the assessment of cycles, refer to the tutorial How To Read Market Structures In Forex
- POC: It refers to the point of control. It represents the areas of most interest by trading volume and should act as walls of bids/offers that may result in price reversals. The volume profile analysis tracks trading activity over a specified time period at specified price levels. The study reveals the constant evolution of the market auction process. If you wish to find out more about the importance of the POC, refer to the tutorial How to Read Volume Profile Structures
- Tick Volume: Price updates activity provides great insights into the actual buy or sell-side commitment to be engaged into a specific directional movement. Studies validate that price updates (tick volume) are highly correlated to actual traded volume, with the correlation being very high, when looking at hourly data. If you wish to find out more about the importance tick volume, refer to the tutorial on Why Is Tick Volume Important To Monitor?
- Horizontal Support/Resistance: Unlike levels of dynamic support or resistance or more subjective measurements such as fibonacci retracements, pivot points, trendlines, or other forms of reactive areas, the horizontal lines of support and resistance are universal concepts used by the majority of market participants. It, therefore, makes the areas the most widely followed and relevant to monitor. The Ultimate Guide To Identify Areas Of High Interest In Any Market
- Trendlines: Besides the horizontal lines, trendlines are helpful as a visual representation of the trend. The trendlines are drawn respecting a series of rules that determine the validation of a new cycle being created. Therefore, these trendline drawn in the chart hinge to a certain interpretation of market structures.
- Correlations: Each forex pair has a series of highly correlated assets to assess valuations. This type of study is called inter-market analysis and it involves scoping out anomalies in the ever-evolving global interconnectivity between equities, bonds, currencies, and commodities. If you would like to understand more about this concept, refer to the tutorial How Divergence In Correlated Assets Can Help You Add An Edge.
- Fundamentals: It’s important to highlight that the daily market outlook provided in this report is subject to the impact of the fundamental news. Any unexpected news may cause the price to behave erratically in the short term.
- Projection Targets: The usefulness of the 100% projection resides in the symmetry and harmonic relationships of market cycles. By drawing a 100% projection, you can anticipate the area in the chart where some type of pause and potential reversals in price is likely to occur, due to 1. The side in control of the cycle takes profits 2. Counter-trend positions are added by contrarian players 3. These are price points where limit orders are set by market-makers. You can find out more by reading the tutorial on The Magical 100% Fibonacci Projection