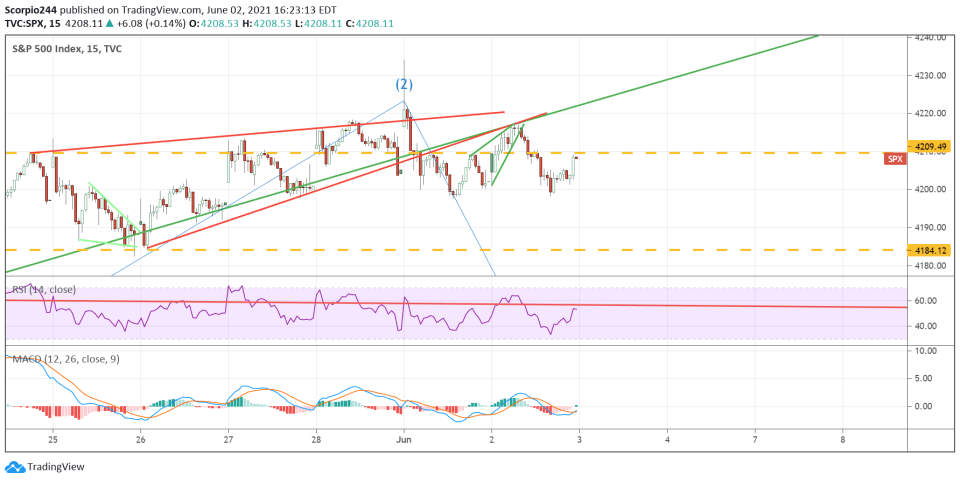
Stocks finished mostly flat, with the S&P 500 up just 15 bps. The market is waiting for Friday’s job data because, at this rate, we haven’t gone anywhere since May 24. I’m not sure if the jobs report will reveal anything revolutionary; it is, of course, the last report before the next FOMC meeting.
Trying to predict the job report has been anything but easy, and this month is likely not to be very different. The ADP job report hasn’t even been a valuable tool, so the S&P 500 may be feeling incredibly flatfooted here. If you remember, the S&P 500 ran up after the weak April job print, and that set the record high.
The index got up to 4,215 Wednesday, and that was where it stopped rising. That was the ideal place to stop as it did offer resistance. We should really drop today from here for the pattern to follow through, with 4,185 being the ideal level for finding some support.
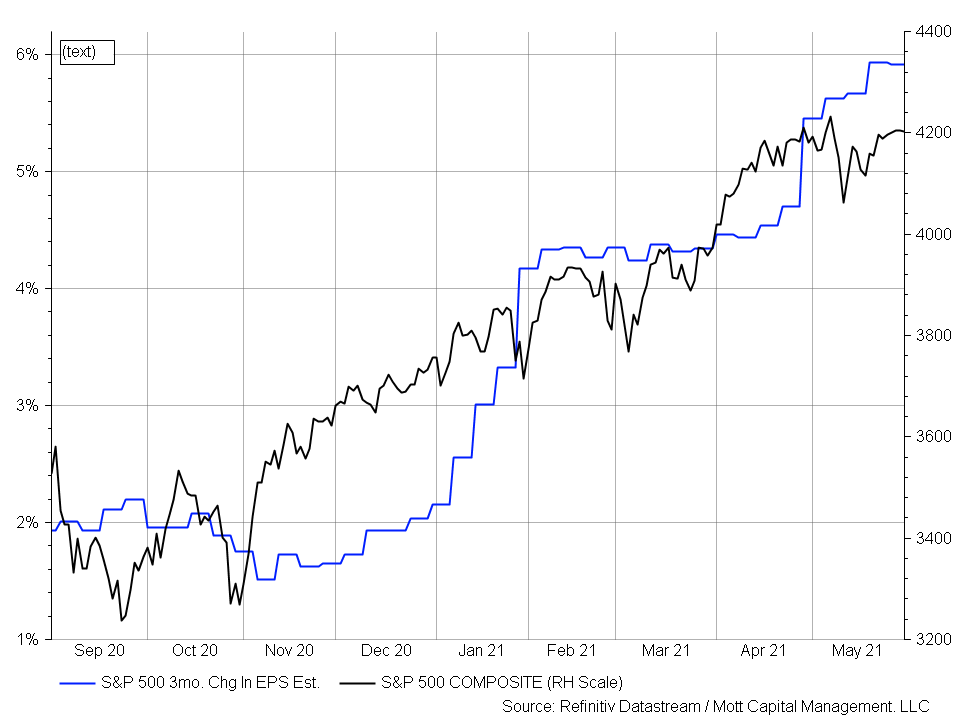
The index may be stagnating due to the leveling-off of changes in the 18-month forward earnings estimates. Perhaps worse is that the market is anticipating a change in trend. Either way, there is a clear relationship between the two, and it bears watching.
Home Depot
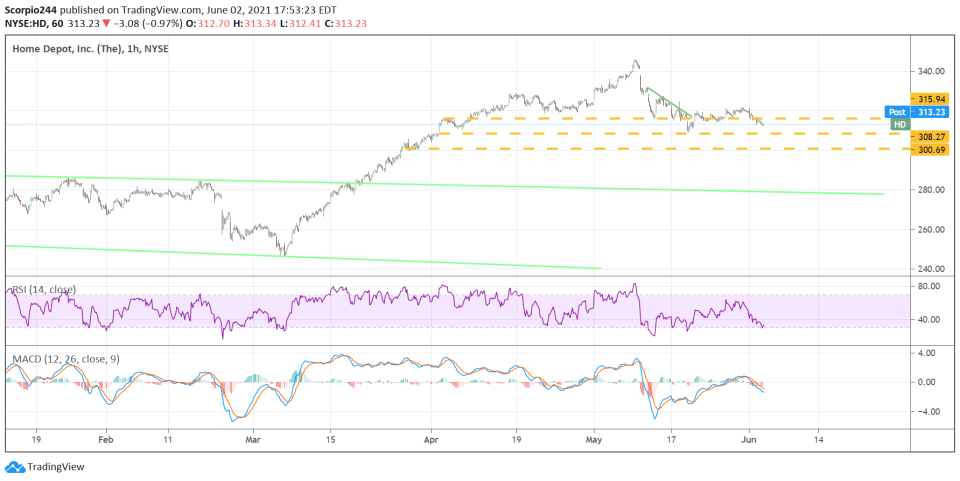
Home Depot (NYSE:HD) fell again yesterday and was approaching that key level of support at $308. A break of support will really be a bad sign for the stock, with not much standing in the way of the shares falling all the way back to $280.
Home Depot happens to be an important stock, as it has a nearly 6.3% weighting in the Dow Jones Industrials Average and a nearly 9% weight in the Consumer Discretionary ETF. So, where Home Depot goes really does matter.
Dow Jones Transports
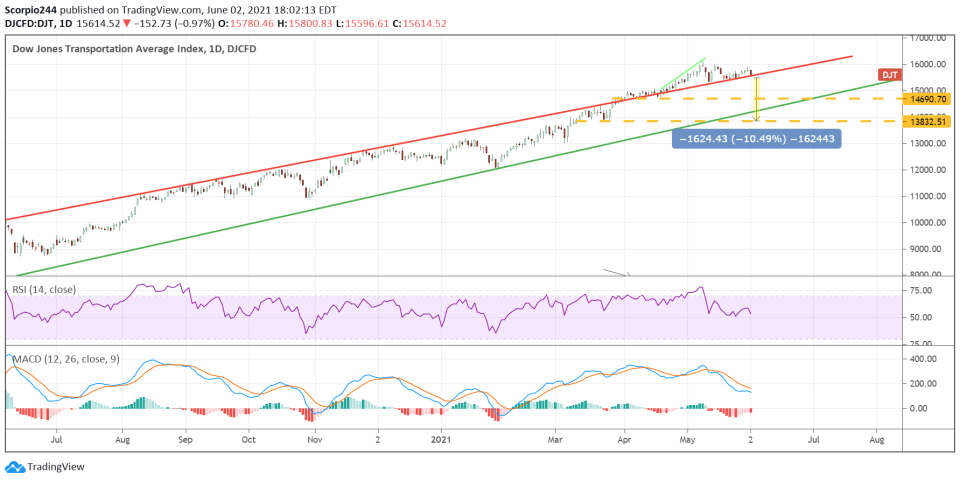
It might be a good time to start watching these transportation stocks, as the Dow Jones Transport Average is very close to breaking a serious support level.
The average is sitting right on the trend line, and if that breaks, the next stop is about 5% lower, to as much as 11%. If this sector breaks, it could send a very bad warning sign for the state of the reflation trade since there is no group more sensitive to the economic recovery.
UPS
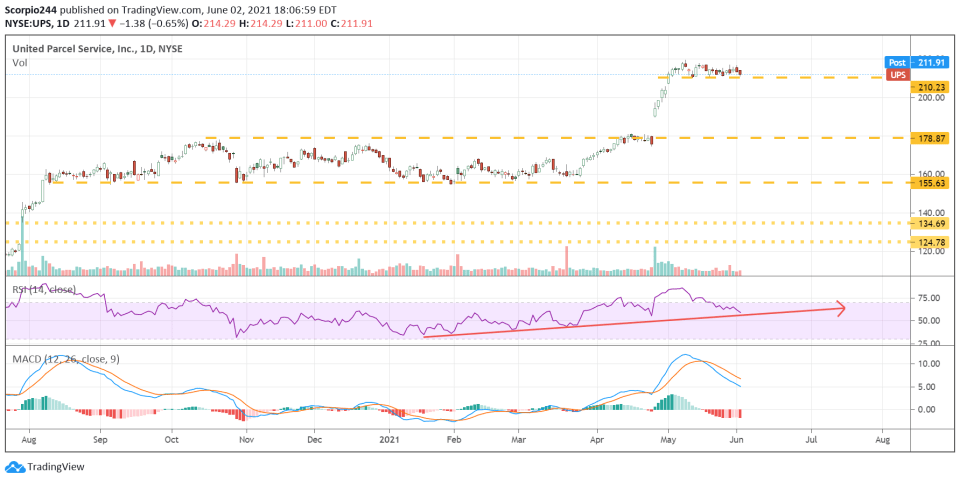
The trends in United Parcel Service (NYSE:UPS) do not look strong, with the stock sitting on support at $210. A break of that support level sends the stock towards a gap fill all the way back at $180. The RSI is very close to breaking an uptrend.
Federal Express
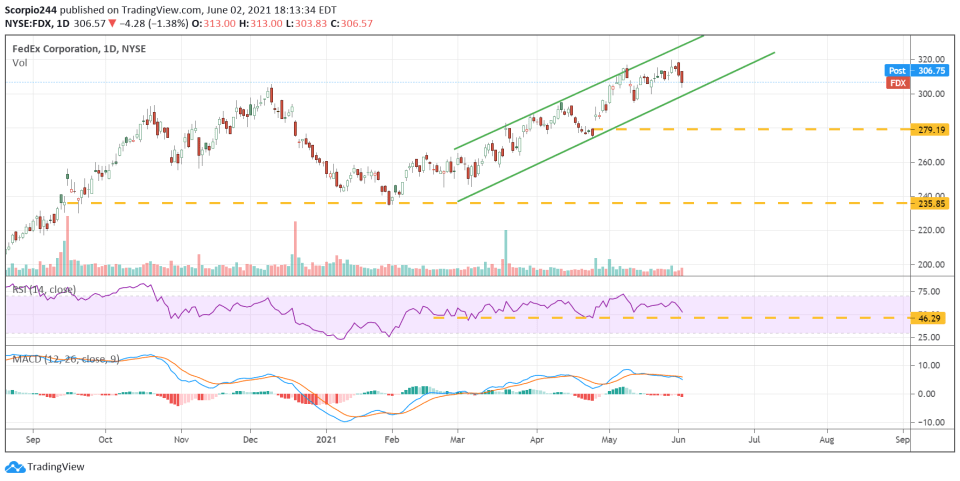
FedEx (NYSE:FDX) was in a similar situation, with the RSI on the cusp of breaking serious support and the MACD crossing over, signaling lower prices lie ahead. Again, like UPS, there is a giant gap that needs to be filled at $280.

