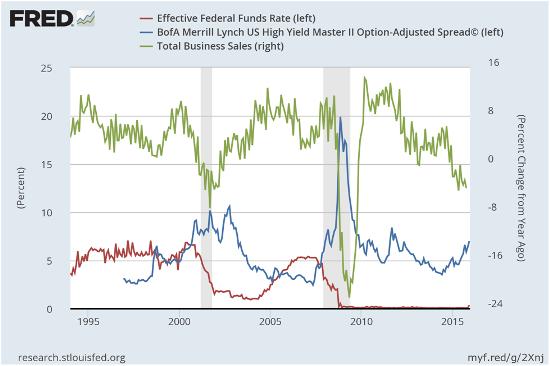
Good friend Michael Pollaro just sent a couple of charts that show the US economy heading for a brick wall. The first illustrates what happens when business sales (the green line) turn negative. In the previous two boom/bust cycles, when sales started falling the economy either tipped into recession shortly thereafter or (it was discovered in retrospect) was already well into a contraction.
Meanwhile, junk bond yields (the blue line) start rising before recession hits and then spike during the contraction, as falling sales hit the weakest borrowers hardest, causing a wave of defaults.
Now compare the previous two busts with today (far right of the chart). Business sales turned negative a year ago and are now heading south fast. Junk yields bottomed in 2014 and are now spiking. If history is a reliable guide, the US is either in recession right now or will be within a quarter or two.
There is one difference, however. Heading into both previous financial crises short-term interest rates (represented here by the Fed Funds rate, red line) were above 5%, giving the central bank some leeway to cut rates and thus stimulate new borrowing. But not this time. Instead, short-term rates are zero or thereabouts and the Fed has just begun a tightening cycle.

Here’s Michael’s take:
What is Junk Market getting that broad equities are not getting? Oh yeah, the economy is decelerating and liquidity is being withdrawn. Basic starting point, learned from my years on the sell side: Pay attention to the junk market. That market is much smarter than the equity market.
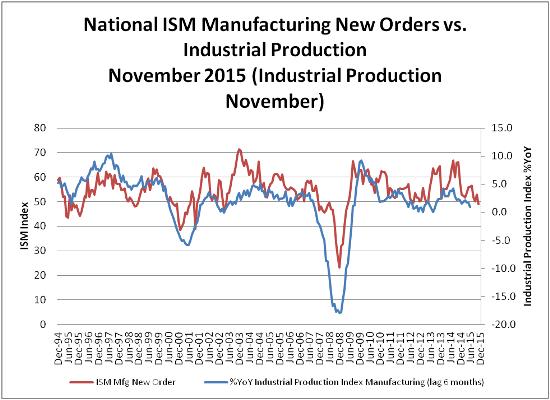
The next chart shows the causal relationship between new factory orders and industrial production, i.e., the amount of real things being produced by US factories. Again, the trend is ominous.

Michael’s take:
Note how ISM New Orders leads Industrial Production. Janet, where is your accelerating economy? I guess in Health Care spending. My insurance is going up 10% next year and is up 50% in 6 years. How about yours?
No doubt autos are big part of what strength there is in manufacturing. I wonder what the recent rise in rates/credit spreads might do to auto sales, then auto production? Car Max numbers may be a hint?
Speaking of CarMax:
CarMax (N:KMX) Hits the Brakes as Used-Car Comps and Net Income Fall
(Fool.com) – The auto industry has been extremely strong in 2015, with automakers on track to report what might be their best sales figures ever. Yet coming into its fiscal third-quarter report on Friday, used-car specialist CarMax (NYSE:KMX) hadn’t enjoyed the same success that the new-car segment had shown, and investors wondered whether the company’s high-growth phase might have come to an end. Even as new-car nationwide chain counterpart AutoNation (NYSE:N:AN) struggles with its own internal challenges, CarMax’s latest quarterly report showed signs of further deterioration in the used-car arena. Let’s look more closely at how CarMax did this quarter and what some shareholders are more nervous than ever about the company’s future prospects.CarMax’s fiscal third-quarter results were unexpectedly weak. Revenue climbed just 4.1% to $3.54 billion, falling well short of the 6% growth rate that most investors had hoped to see from the car seller. Net income fell 1.4% to $128.2 million, and that worked out to earnings of $0.63 per share, which was a nickel per share less than the consensus forecast among investors.
Looking more closely at what CarMax said about the quarter, the slowdown that investors have seen during much of 2015 continued. Total used-vehicle unit sales rose 3.2%, but comparable-store sales of used cars fell 0.8%. The company said that store traffic fell during the quarter, and the improvement in getting sales completed wasn’t enough to offset that downward pressure. Wholesale vehicle sales were up nearly 7%, but CarMax’s tiny new-car sales figures fell by more than a fifth, showing some of the same trends that AutoNation has seen pop up recently.
Car sales have joined student loans as the credit bubble du jour and will have to pop soon, given the combination of record-high sales and soaring subprime lending. If used car sales are an indicator of the future of new car sales, then overall business sales and industrial production will “surprise analysts” by plunging next year.
