The stock market’s rally is extremely persistent to the point where it looks like every single -1% pullback is being bought. This is quite rare, and the last time we saw this was February 2000 (top of the dot-com bubble).
Let’s determine the stock market’s most probable medium-term direction by objectively quantifying technical analysis. For reference, here’s the random probability of the U.S. stock market going up on any given day.

TIME
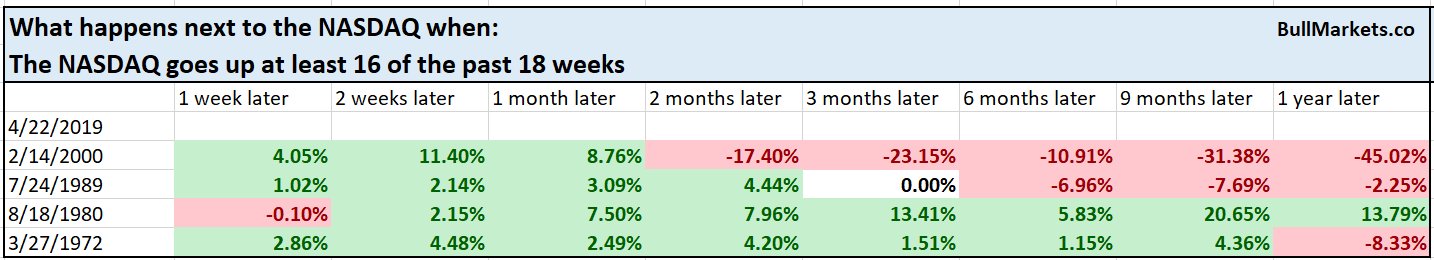
Last week we said that the NASDAQ had gone up 16 of the past 18 weeks:
The rally continues, and the NASDAQ is now up 17 of the past 19 weeks.
From 1971 – present, this has only happened 3 other times:
- February 2000: bull market top
- July 1989: recession and big correction 1 year later
- April 1972: bull market top 9 months later
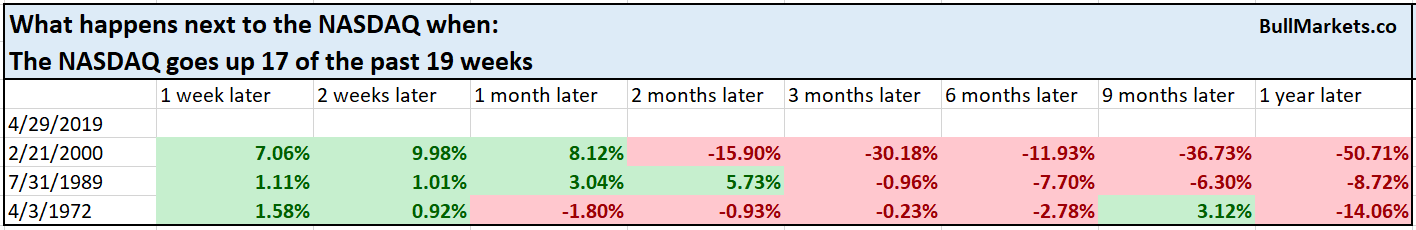
While this may look scary, it’s important to remember that n=3.
Meanwhile, the Nasdaq 100 has gone up 18 of the past 19 weeks. From 1985 – present this has never happened before. Surely this streak must end soon?
As for the S&P, it has gone up 15 of the past 19 weeks. This happens quite often and is not consistently bullish nor bearish on any time frame.
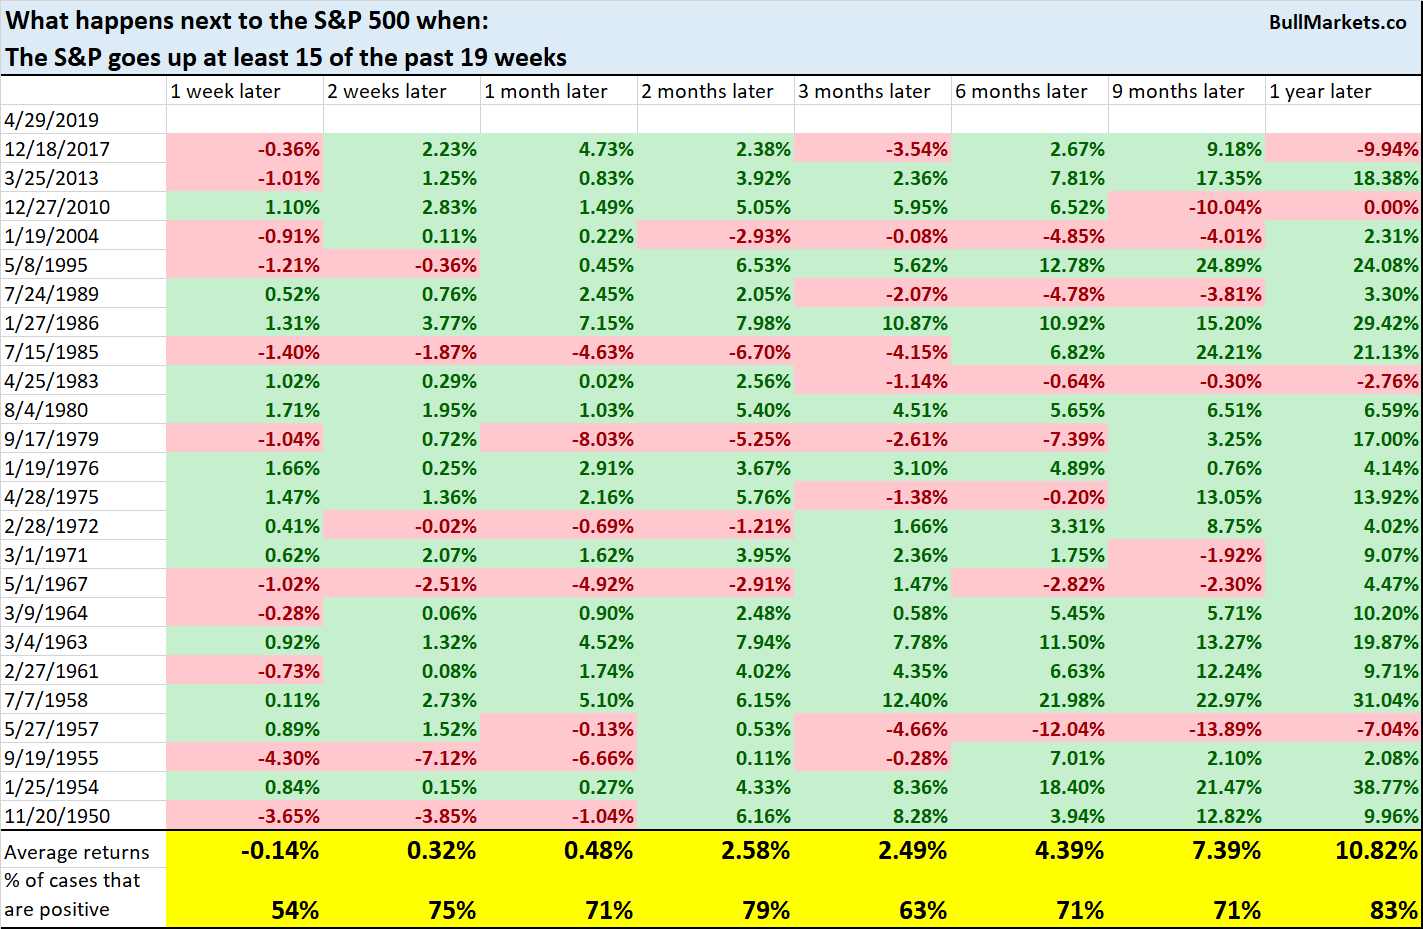
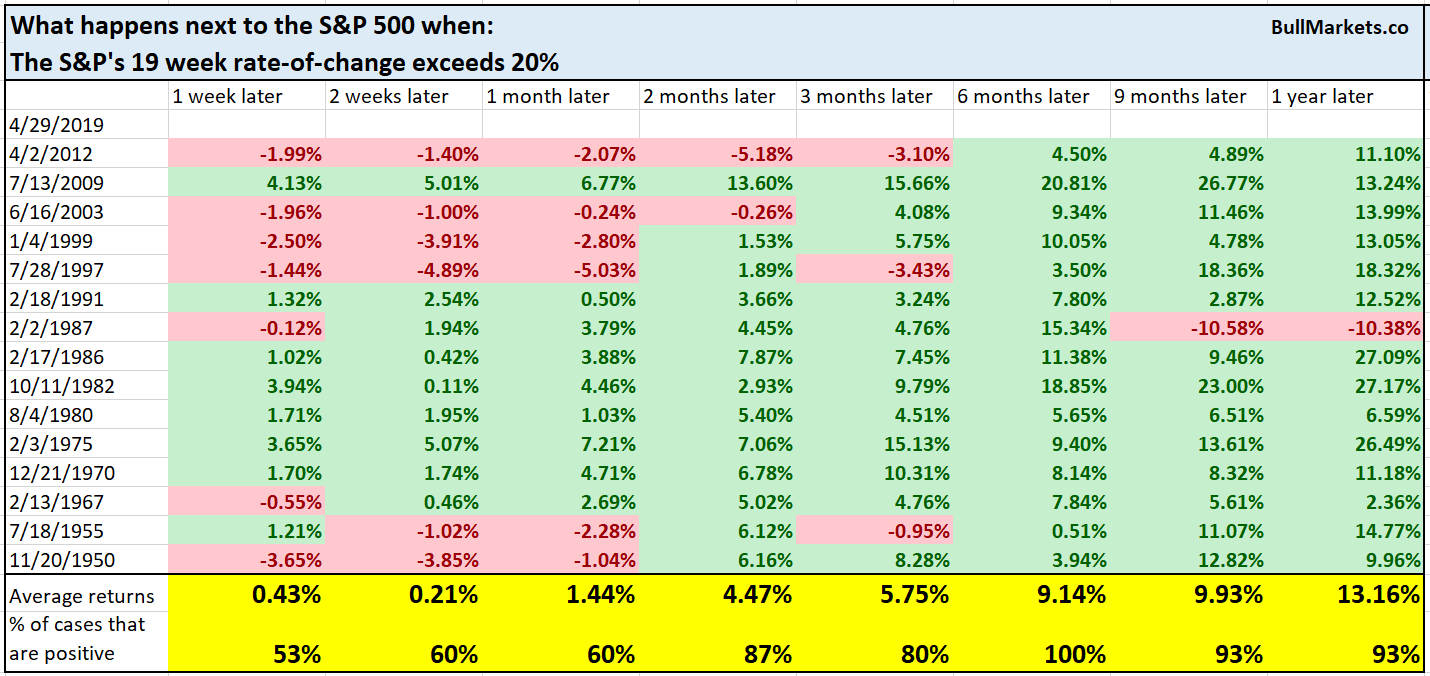
We can look at the stock market’s rally from a MAGNITUDE perspective. The S&P’s 19-week rate-of-change (since the December bottom) is now +21%. Surely the stock market has rallied “too much”?

While the stock market does “eventually” make a correction, similar historical cases were near-universally bullish for the S&P 6-12 months later.
*Data from 1950 – present.
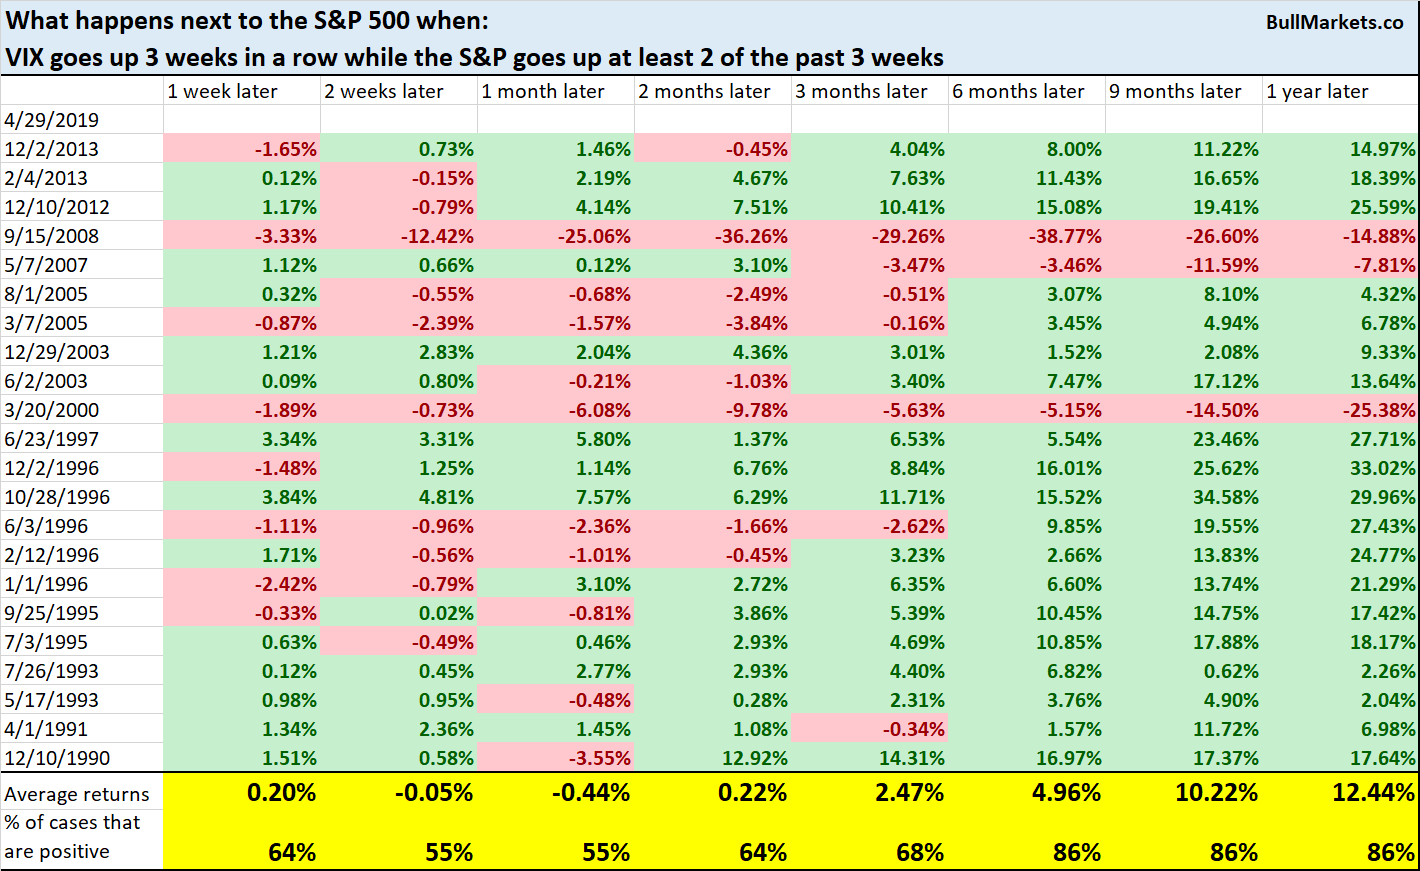
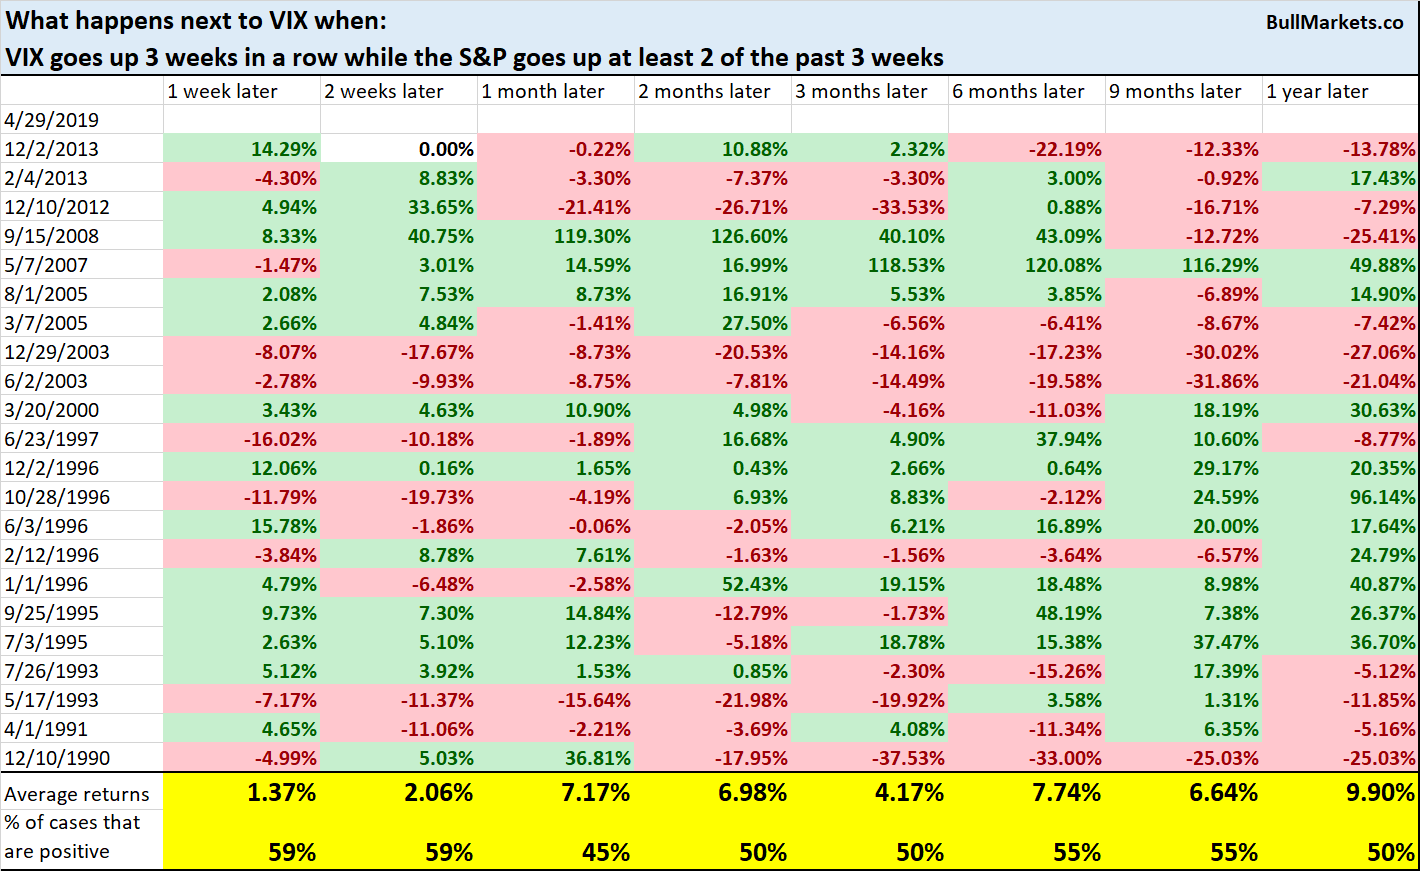
While the S&P has gone up in 2 of the past 3 weeks, VIX has gone up 3 weeks in a row. Surely VIX and the S&P going up together can’t be bullish for stocks?

Surprisingly, this happens quite often. Not consistently bullish or bearish for the S&P or VIX.
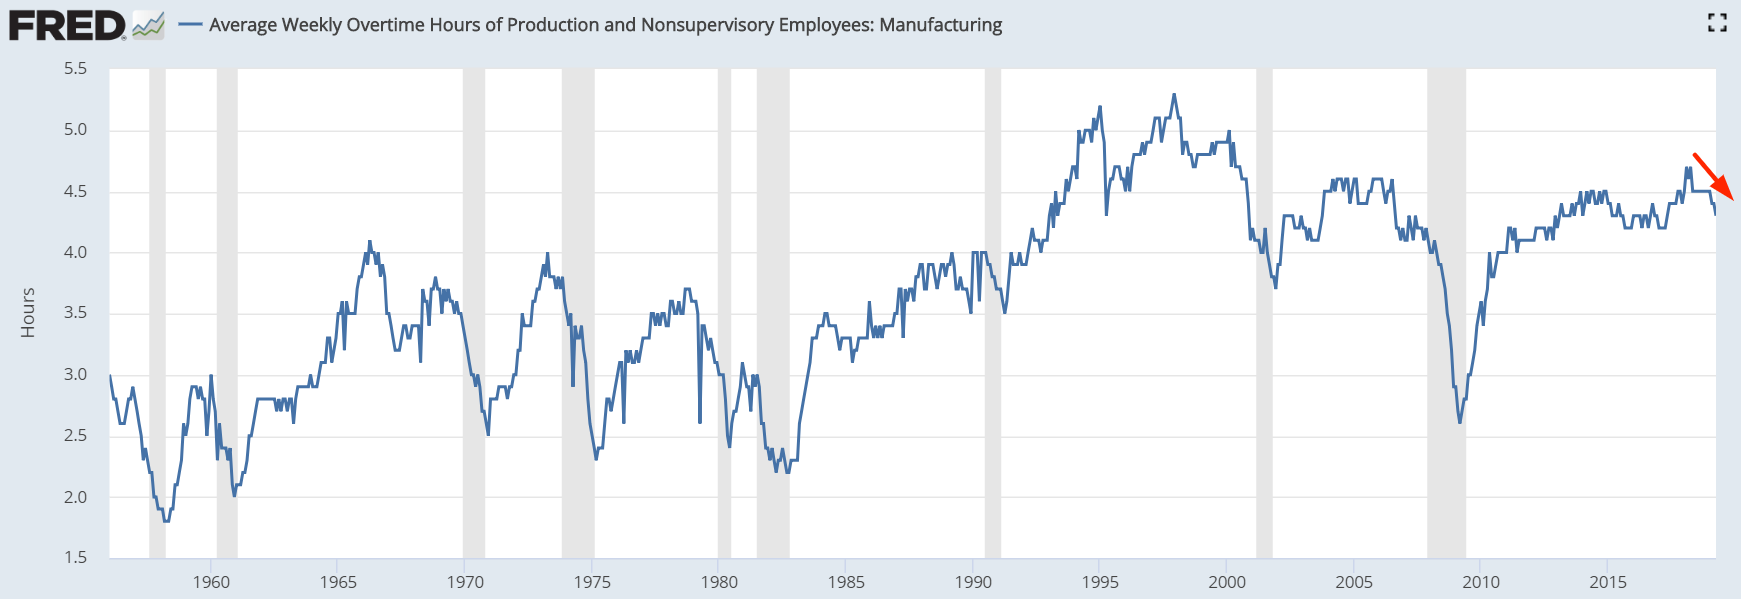
Eric Basmajian noted that average weekly hours worked has been falling. He combined the following 2 economic indicators…
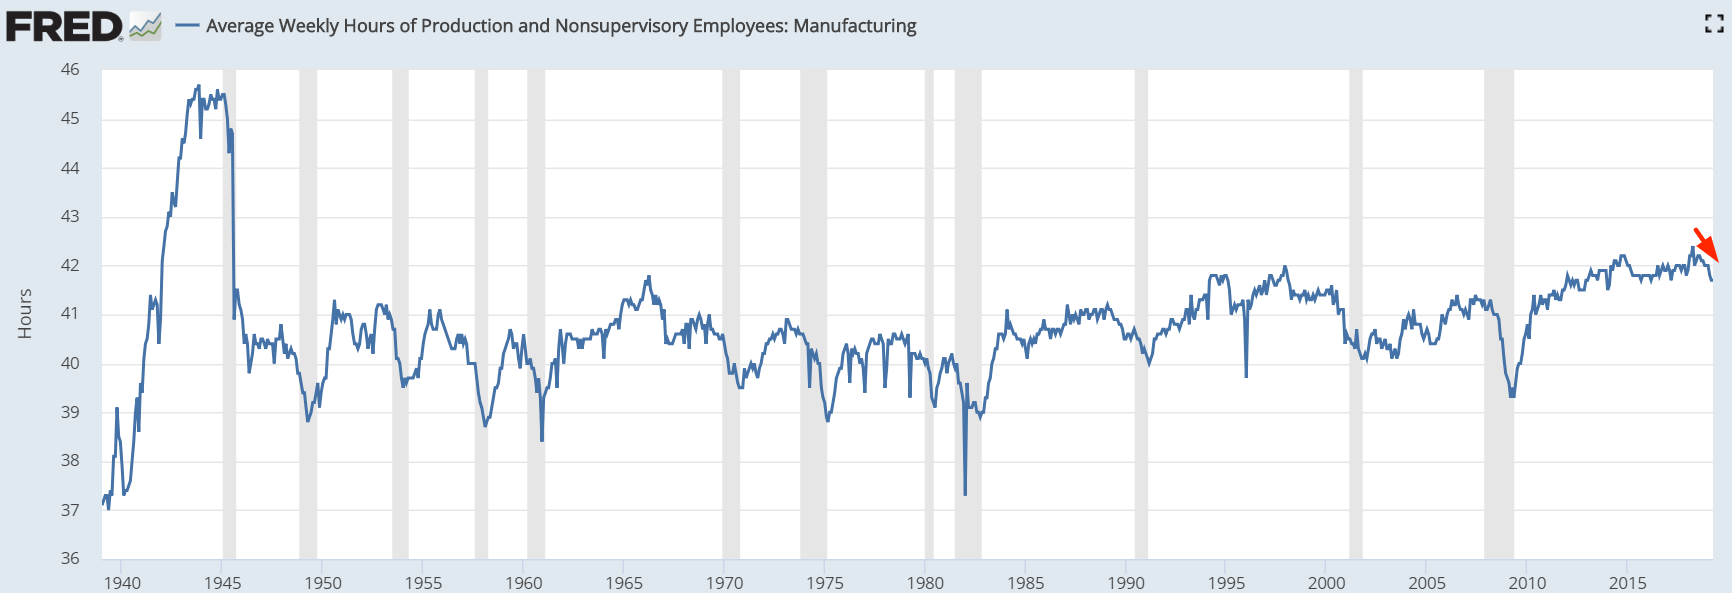
… into this
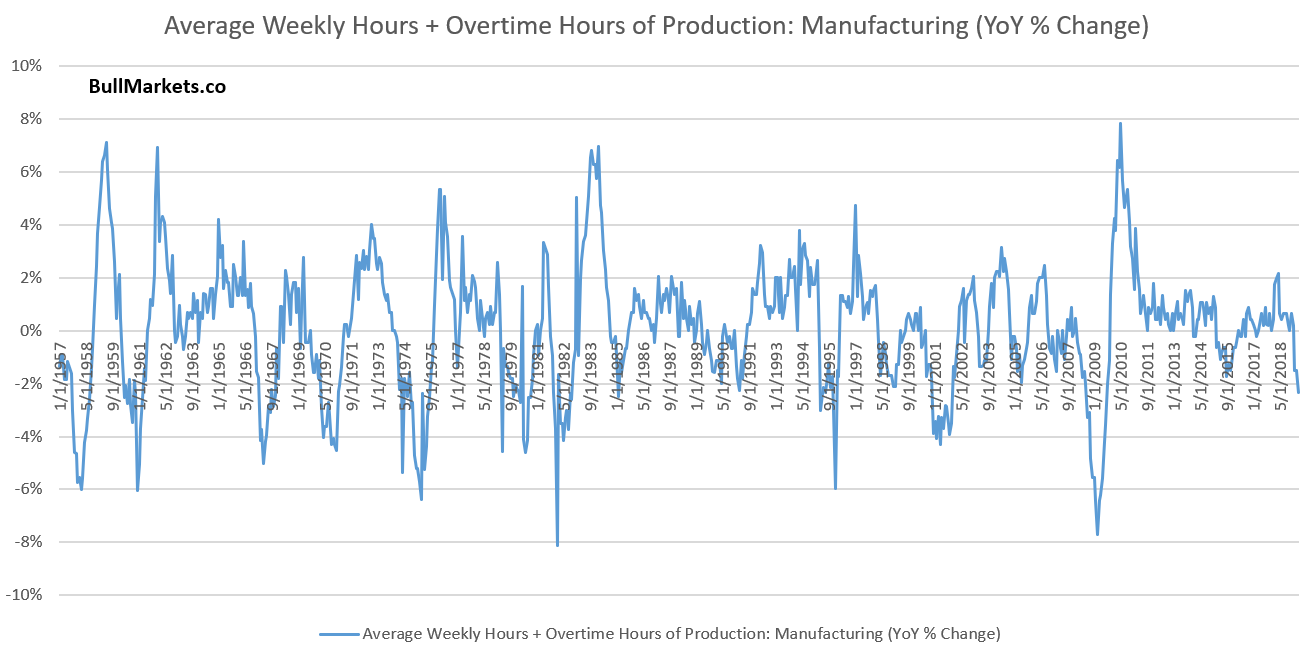
As you can see, the year-over-year % change in hours of production has fallen to the lowest level since 2008! Is this “just like 2001 and 2008 all over again”?
Not quite…
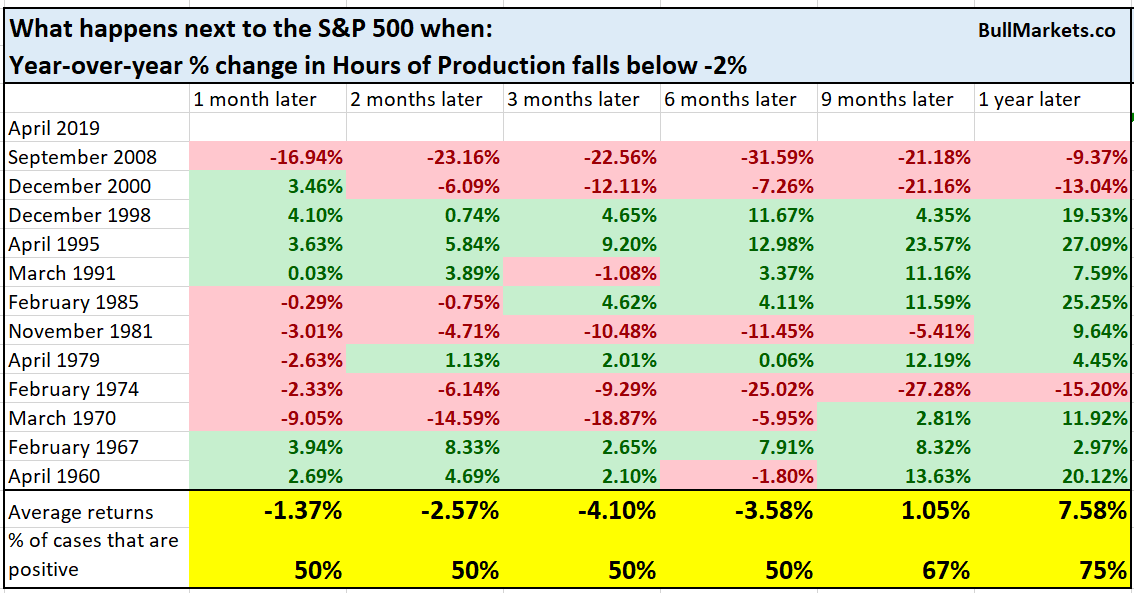
This did happen in the last 2 recessions and bear markets. However, it also happened in other less ominous cases. This economic indicator is indeed useful, but like all economic indicators, should not be treated in isolation. Hence why we use the Macro Index to aggregate economic indicators, which is not “just like 2001 and 2008 right now”.
Breadth
Last week we looked at what happens next to the NASDAQ when it breaks out to a new all-time high, but fewer than 50% of its stocks are above their 200 DMA. To our surprise, this is rare but not consistently bearish.
This week the percent of NASDAQ stocks above their 200 DMA finally rose above 50%, for the first time in more than half a year.

From 2001 – present, these breadth breakouts were mostly bullish 3-12 months later.
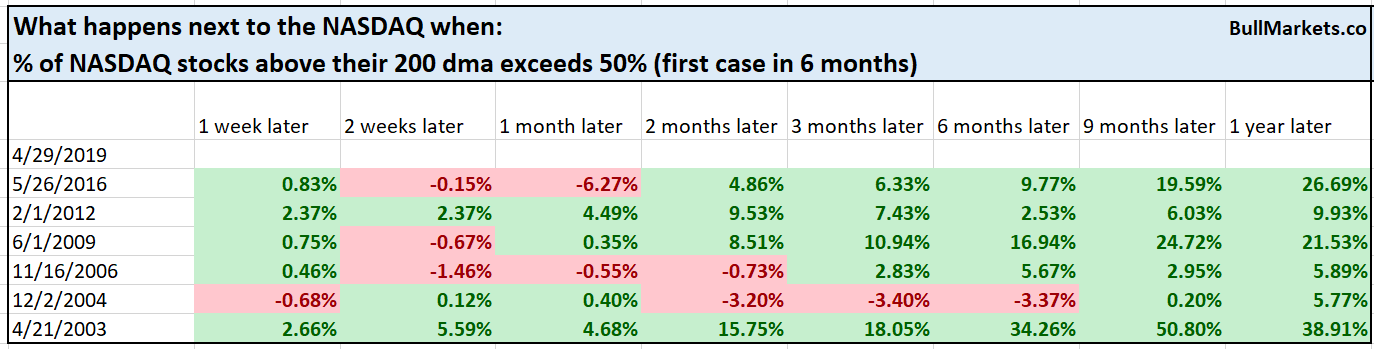
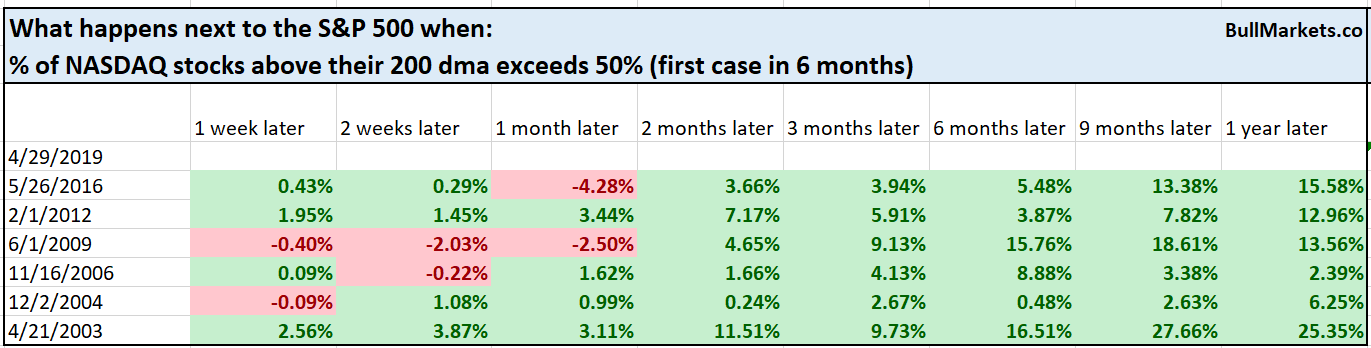
*The data is limited from 2001-present and the sample size is small, so take this with a grain of salt.
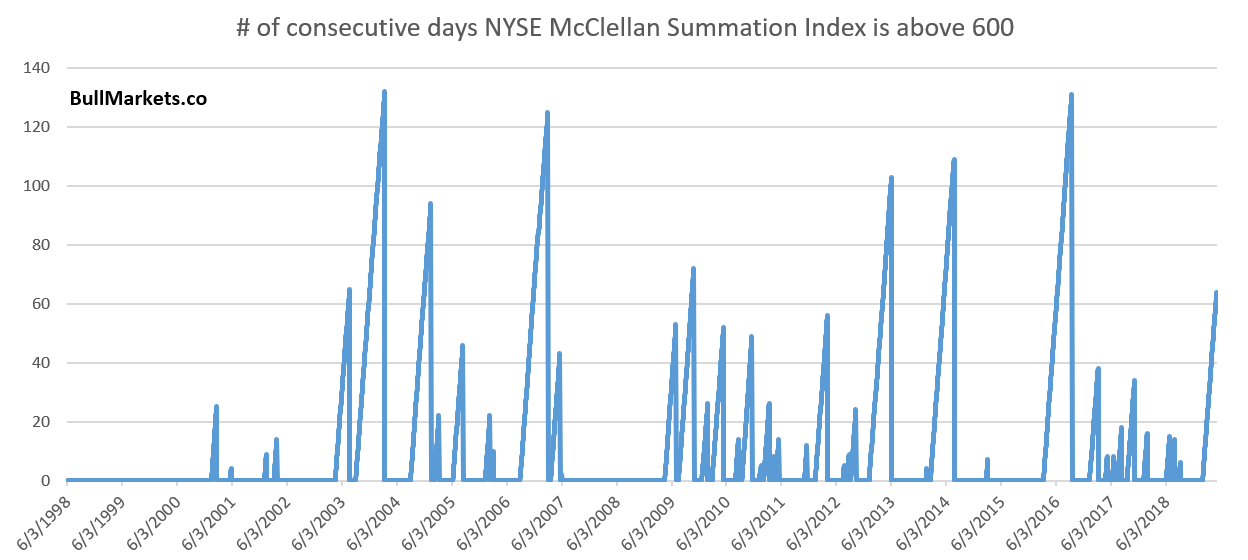
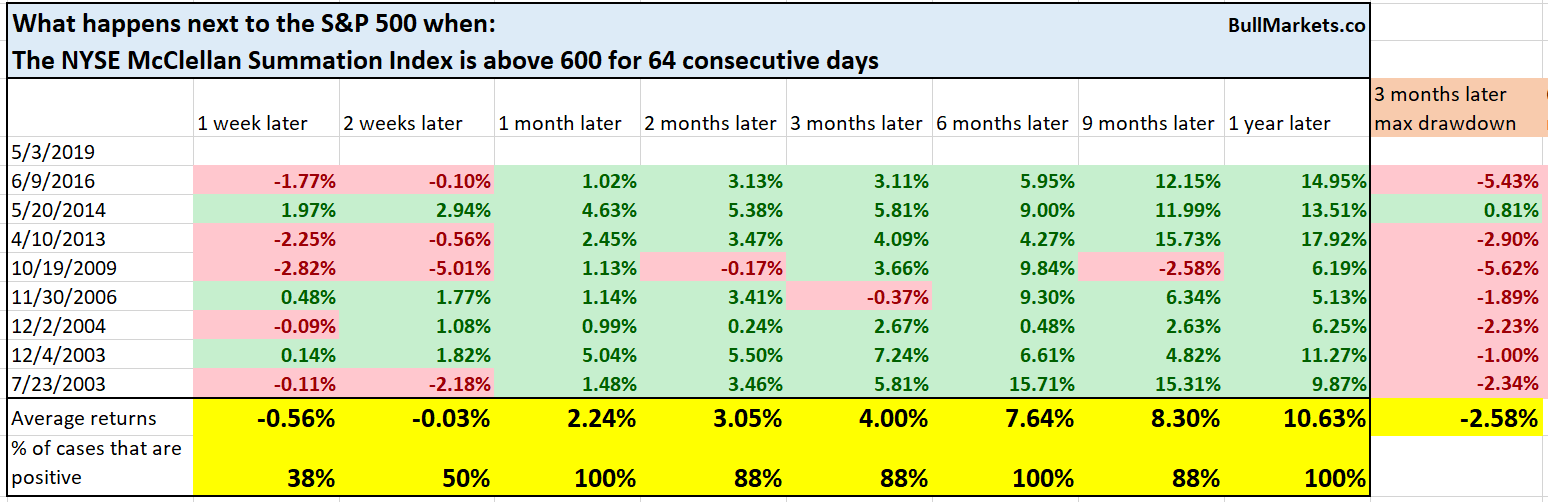
Meanwhile, the NYSE McClellan Summation Index (another popular breadth indicator) has been above 600 for 64 consecutive days. That’s quite the streak of decent breadth.

Similar historical streaks were mostly bullish for the S&P. And the 3-month max drawdowns were mostly shallow, with the largest at -5.6%
Oil leading the S&P down?
The S&P and oil have had a very strong correlation from September 2018 – present. With oil now falling, their correlation has broken down.

Does this imply that “oil is leading the S&P downwards”?
Here’s what happens next to the S&P when the S&P and oil’s 20 day correlation goes from above 0.9 to below zero within 1 month.
*Data from 1983 – present.
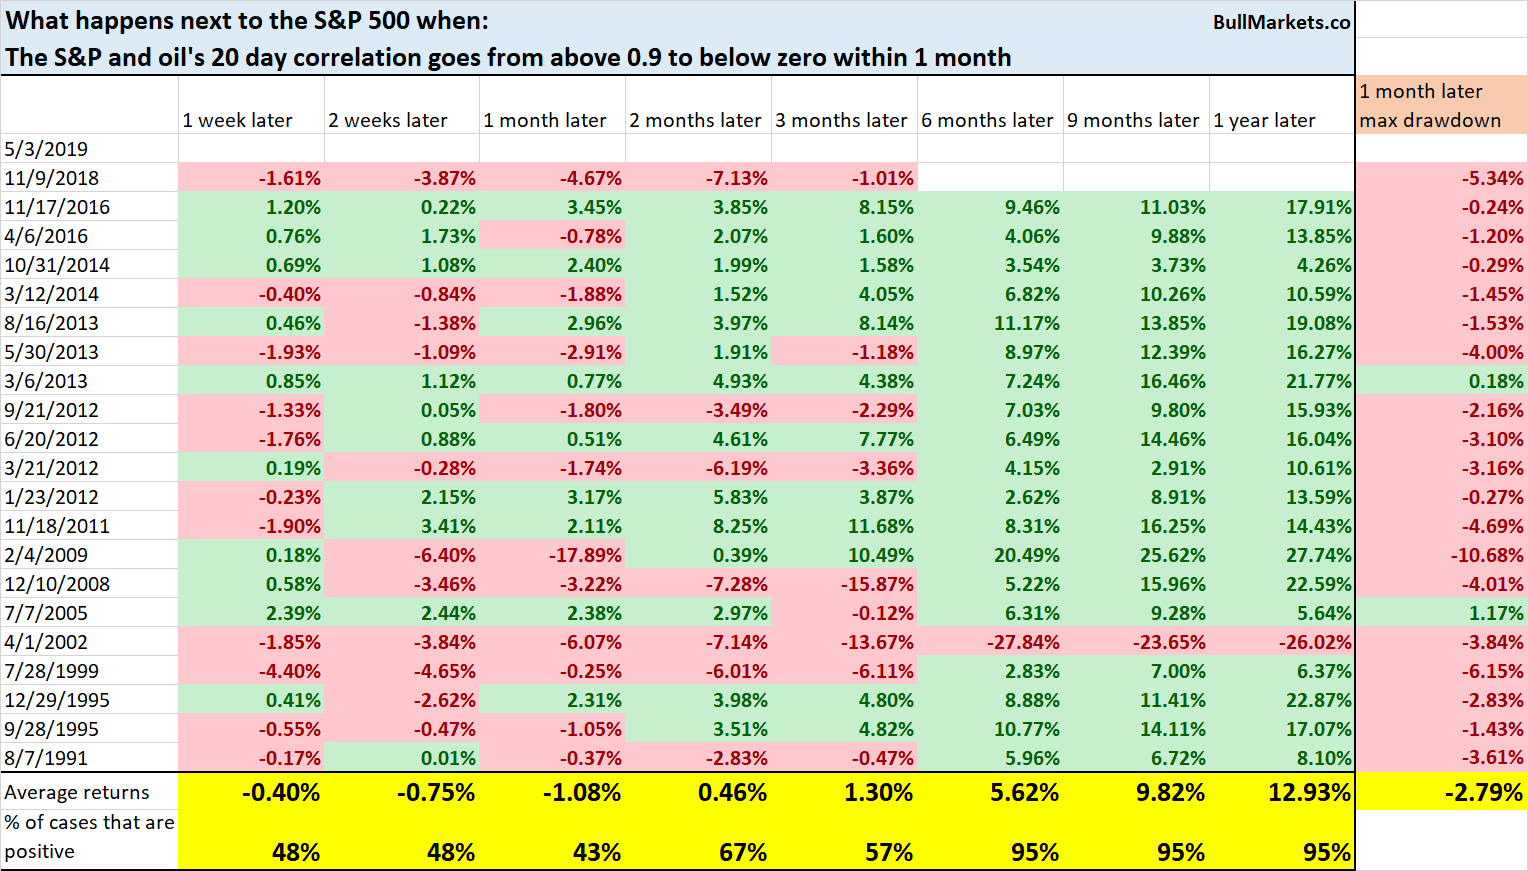
Somewhat short-term bearish for the S&P…
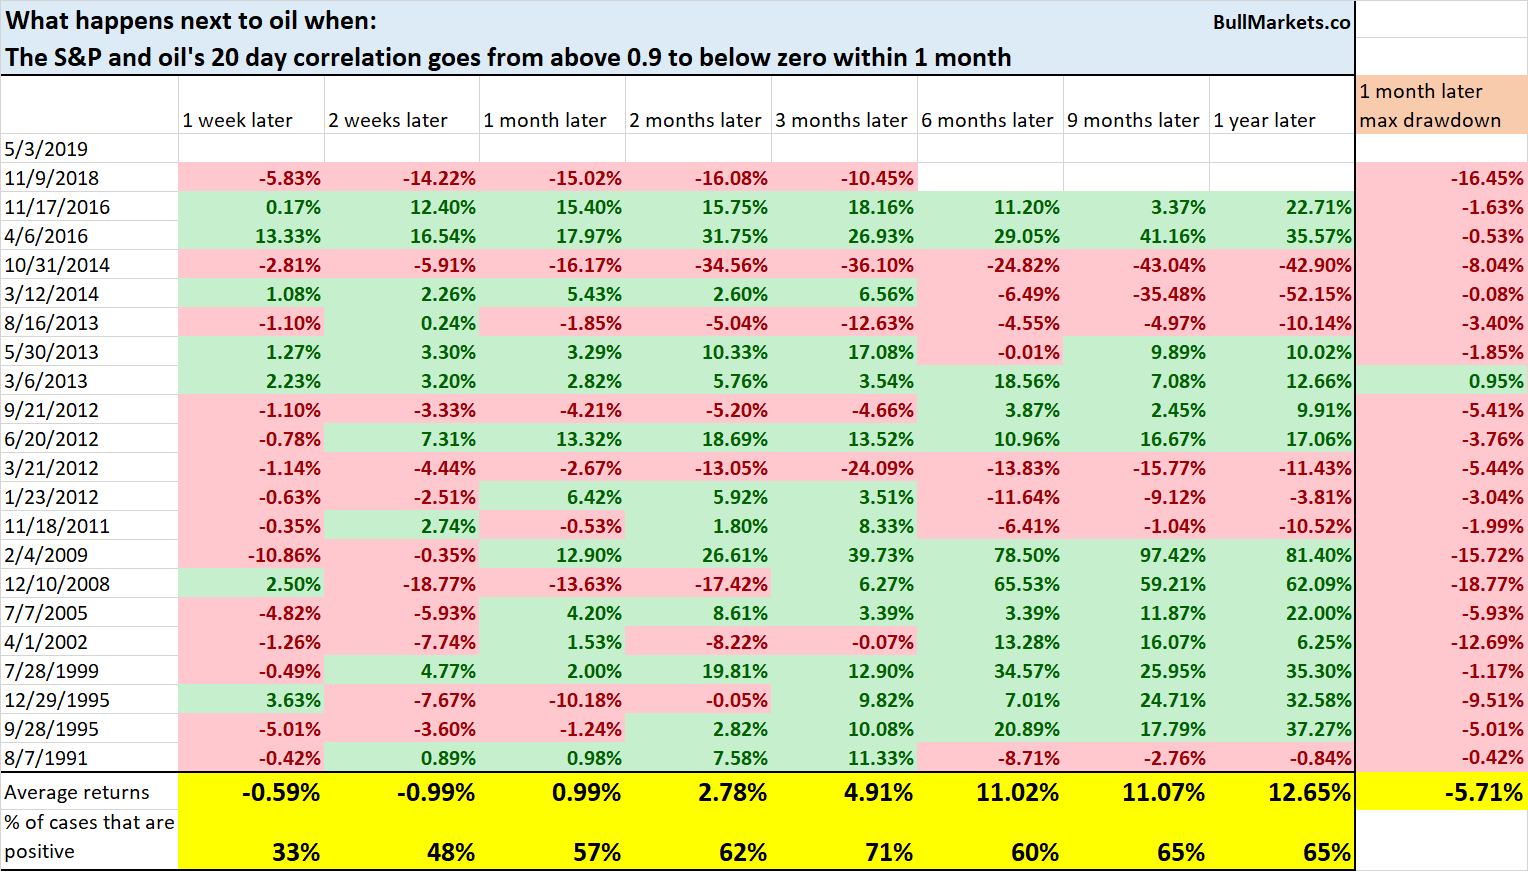
And somewhat short term bearish for oil…
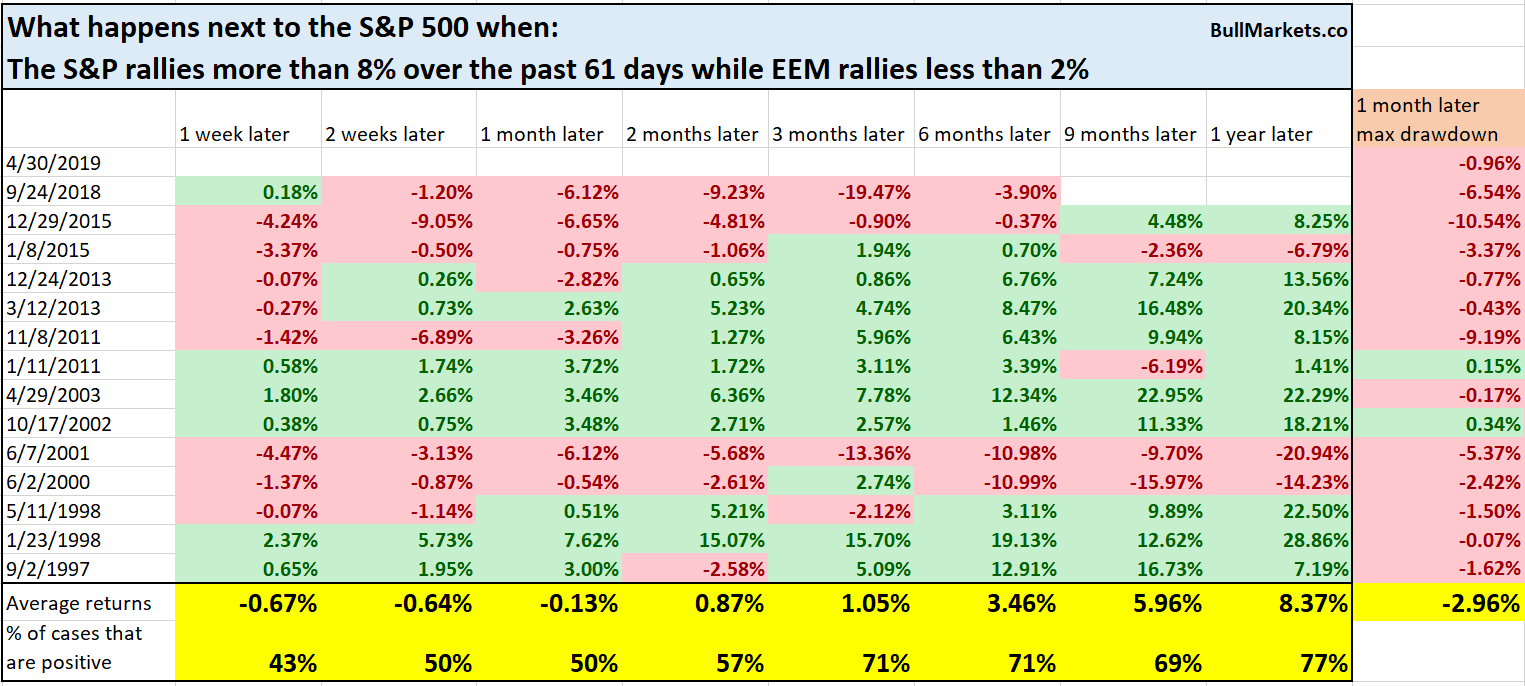
Emerging markets
A few days ago we looked at why emerging markets have underperformed the S&P so badly over the past 10 years despite consistently lower valuations (hint: it has to do with their lack of earnings growth).
And despite all the hype behind emerging markets, EEM (emerging markets ETF) has lagged the S&P from February – present

Here’s what happens next to the S&P when it rallies more than 8% over the past 61 days while EEM rallies less than 2%.
Here’s what happens next to EEM.
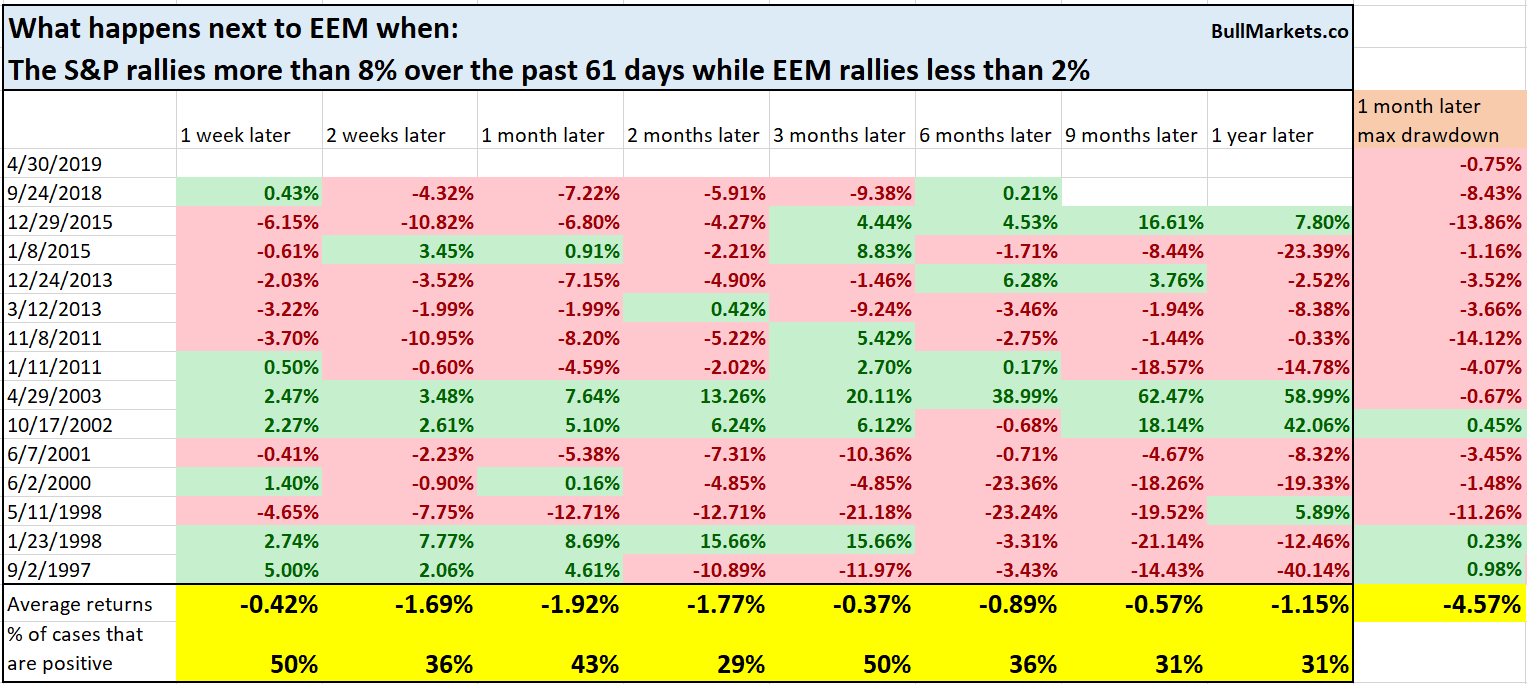
You can see that this is much more bearish for emerging markets than the U.S. While I’m not a big fan of catchy trading phrases, there is some statistical validity to “buy strength, sell weakness” (momentum factor).
Conclusion
Here is our discretionary market outlook:
- The U.S. stock market’s long term risk: reward is no longer bullish. In a most optimistic scenario, the bull market probably has 1 year left. Long term risk: reward is more important than trying to predict exact tops and bottoms.
- The medium-term direction (e.g. next 6-9 months) has a bullish lean.
- We don’t predict the short term because the short term is always extremely random, no matter how much conviction you think you have. Focus on the medium-long term.
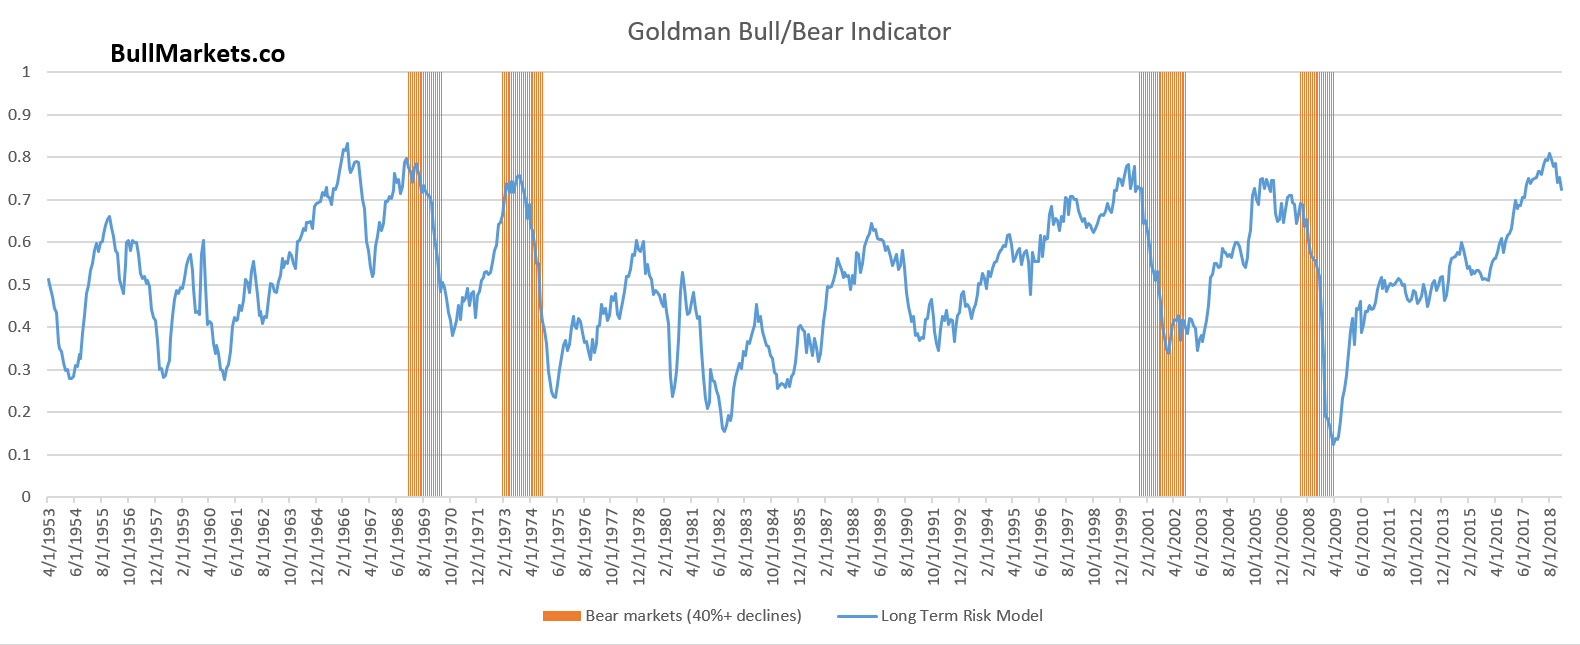
Goldman Sachs’ Bull/Bear Indicator demonstrates that risk: reward does favor long term bears.