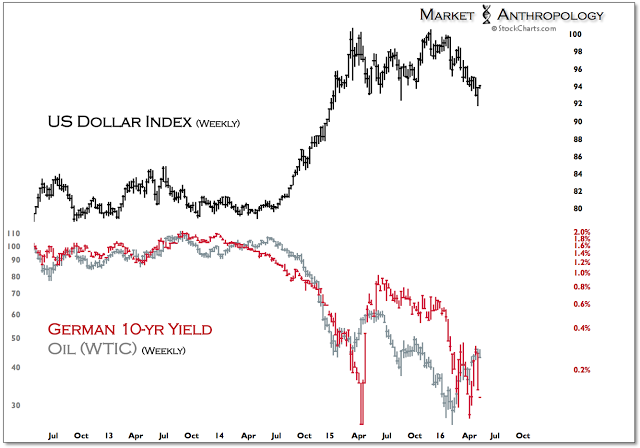
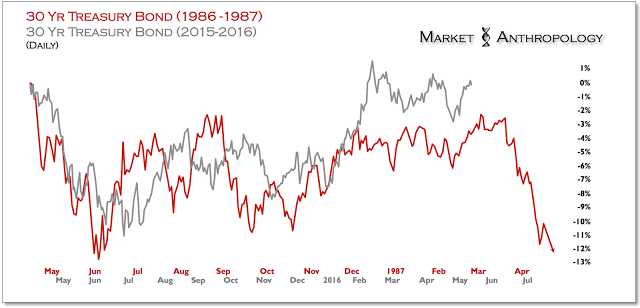
After watching some markets develop over the past week, we thought it warranted a few thoughts on a possible outlier outcome in the Treasury market over the next several weeks.
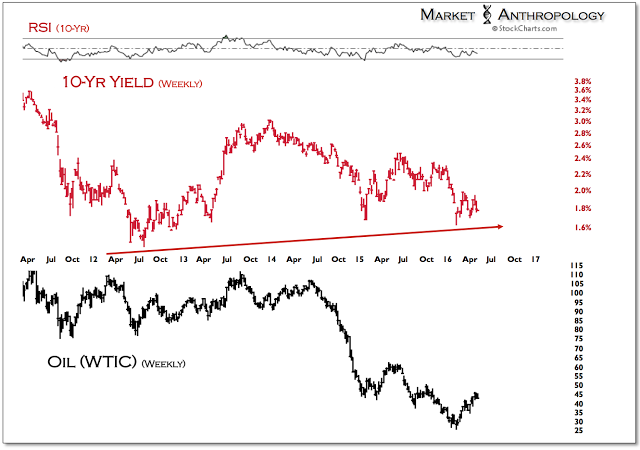
Since Treasuries made their respective highs in mid February, we held an intermediate-term outlook that yields could drift higher through the spring, before exogenous market pressures again arose pushing participants back into the safe haven shores of Treasuries. Overall, yields have drifted above their respective lows from February; albeit, modestly and in a flagging and diminishing range from the highs in early March.
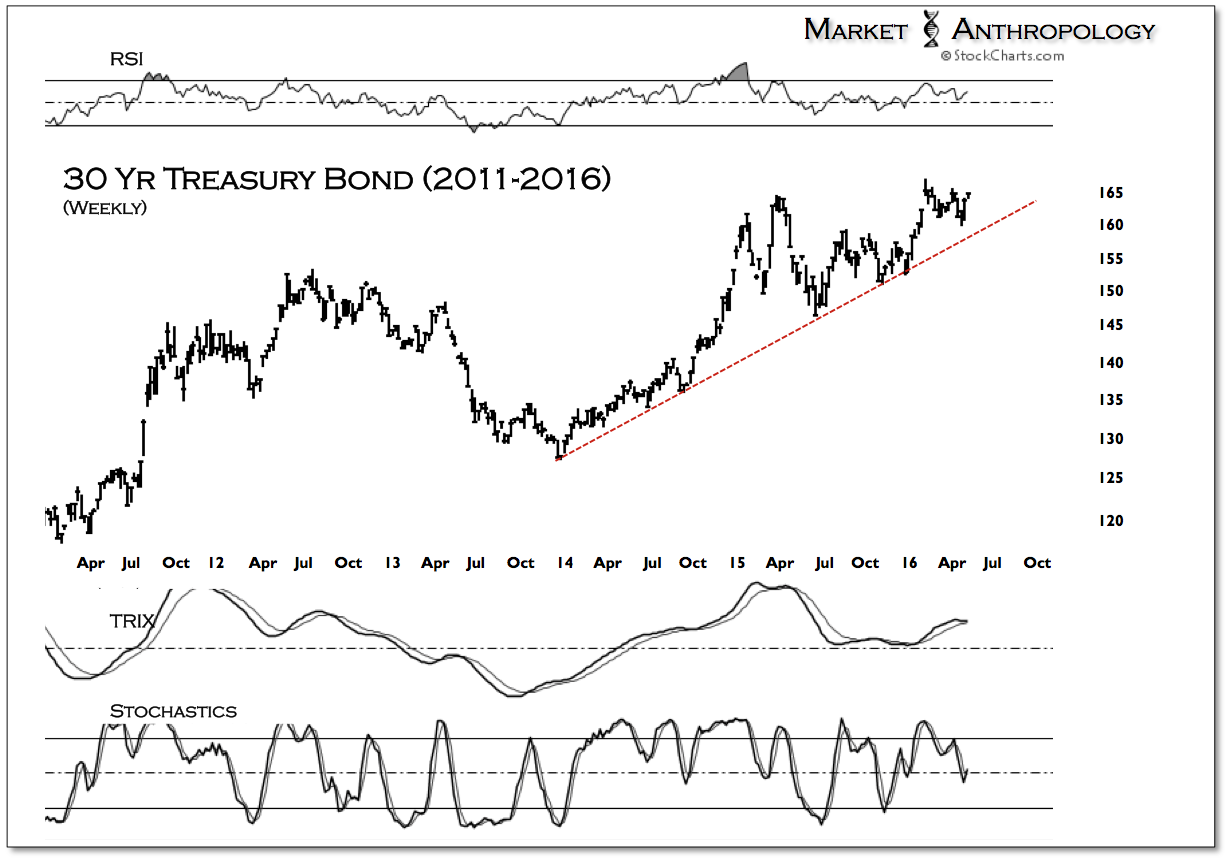
While the backdrop for long-term Treasuries has largely remained a benevolent place for investors this year, the markets have again traded in a descending range from their February highs, which in the past has presaged a subsequent trend shift lower.
Taken in context with the broad range that long-term Treasuries have remained in since their momentum highs back in January 2015, a potential break below support extending from their late December 2013 lows – could accelerate downside pressures and markedly extend our outlook for a rising yield environment beyond Q2.
Considering fund flows this year that have overwhelmingly remained out of equities and into bonds, a major breakdown in Treasuries could result in another rotation back into equities. That said, at this point in the cycle we're more comfortable speculating on the short-side of Treasuries here, rather than a derivative bet on this potential outcome.
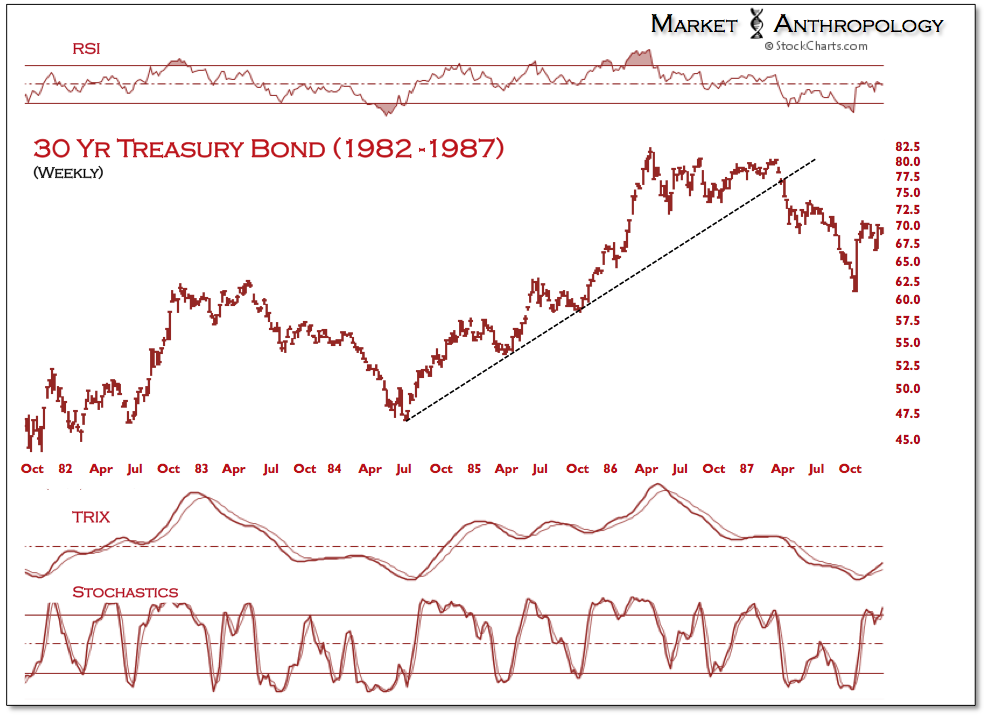
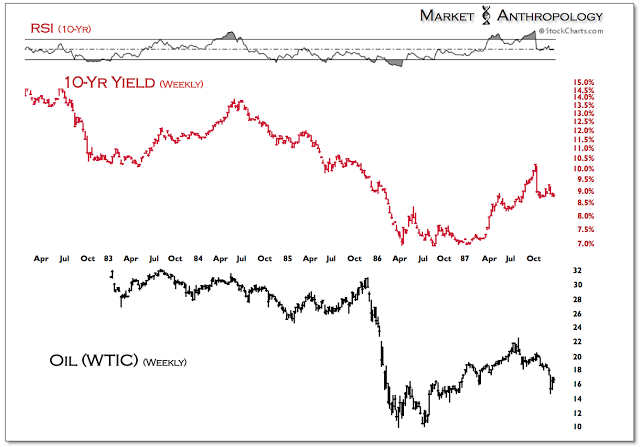
One historical period that we have been following for possible insights is the market environment headed into the spring of 1987, where investors had pushed long-term Treasuries significantly higher over the previous two years on the back of a sluggish global economy and a collapse in oil prices. It wasn’t until the global economy stabilized and oil prices began moving higher that the Fed began to raise rates in April 1987.
This shift, following several years of disinflationary market conditions that had greatly buttressed the trend in Treasuries – came to an abrupt end that spring. Headed into October, the price on the 30-year Treasury bond had fallen by over 20 percent.
Although we would never hold a position with commensurate expectations to an outlier outcome such as the bond crash in 1987, the levels of pessimism prevalent today regarding the state of the US and global economy could provide ample contrarian tinder should they largely go unfounded.
Despite panning the prospects for equities here in the US and belief that monetary policy helped inflate stock valuations above their more fundamental underpinnings – we don’t buy into the deflationary thesis that sees the US and global economy sinking into another recession based on a more pernicious economic malaise.
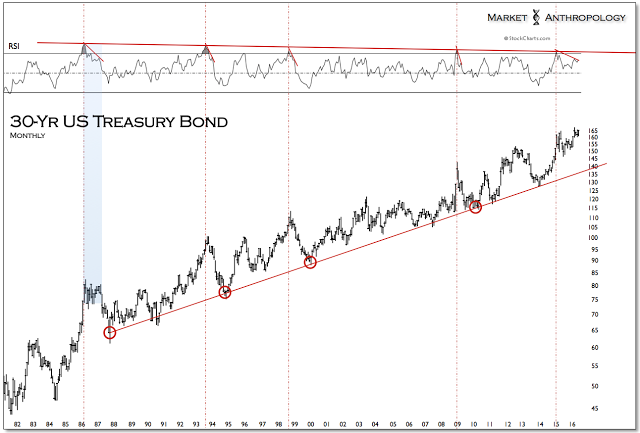
As such – and considering the current set-up in long-term Treasuries going into Q3, we are now on the lookout for prices to test and break below support (Figure 1) extending from the late December 2013 lows. Should this occur, we'd speculate that prices could fall back to long-term trend line support extending from the 1987 crash low. In the five previous occasions that long-term bonds exhausted with a momentum extreme (as based on RSI - Figure 3), they eventually found support at this rising trend line.
From our perspective, the current set-up that holds structural and momentum similarities with the broad top in bonds in 1986 and 1987, warrants taking a swing on the short-side of the field.
 | ||||
|
 |
