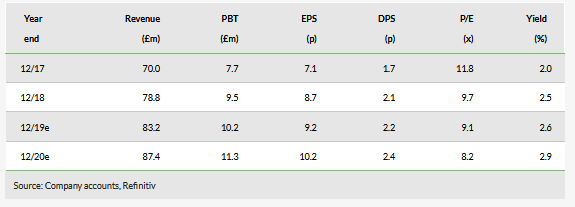
Mission Marketing Group (LON:TMMG)’s new CEO James Clifton, appointed in April, is setting his stamp on the group, recasting it as a business partner for brands. The name change from The Mission Marketing Group reflects this new approach. He is accelerating internal collaboration and a multi-agency approach, as well as simplifying the internal structure. H1 trading and recent new business wins are indicating early validation. Operating margins should improve as more support services are provided centrally, with market estimates indicating 14.0% for FY21e, from 12.6% in FY18. The valuation remains at a sizable discount to peers.
Simplifying the structure
MISSION is consolidating its number of agency brands from 16 to 11, with clearer market propositions aimed at addressing clients’ business challenges. The group name change (losing ‘Marketing’) is better aligned to this approach. The ‘Mission’ name is not well recognised within the industry and the client base, where the individual agency names carry the traction. A greater emphasis on the group identity should help encourage cohesion and further collaboration, enabling group agencies to pitch for larger pieces of business.
On track for full year
Operating income in H119 grew by 8.6% vs the prior period, well ahead of the anticipated UK 2019 growth of 4.8% (source: WARC). Operating margins were slightly lower though, at 9.2% vs 9.6%, reflecting the timing of client spending. Group profits are always H2 weighted and MISSION is on track to meet full year market expectations. Operating profits have split on average by 38%:62% H1 to H2 over FY13–18. Margins are expected to continue to increase with the greater efficiency from sharing services across agencies. Management considers that cash obligations on earn-outs (£2.3m in the next 12 months, £5.9m in the subsequent 12 months) can be met ‘comfortably’ from cash generated. Net debt at the half year was £5.1m (increased to £12.7m on the application of IFRS 16), from £4.0m at end FY18, despite £3.2m of acquisition payments in the period.
Valuation: Continuing overstated discount
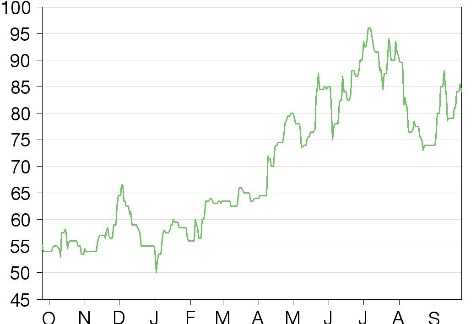
MISSION’s share price has come off the highs reached in July (96p at the peak) but has nevertheless increased by 56% ytd. However, its valuation remains at a clear discount to quoted small-cap marcomms peers. The current price puts it on an FY19e EV/EBITDA multiple of c 7.2x, vs the sector at 10.6x, a 32% discount; on a P/E basis, a multiple of 9.1x compares to peers at 13.2x. The scale of these discounts remains difficult to justify given the earnings growth and further improvements in the balance sheet.
Share price graph

Consensus estimates

Business description
MISSION is a marketing communications group employing 1,150 people in the UK, Asia and the US.