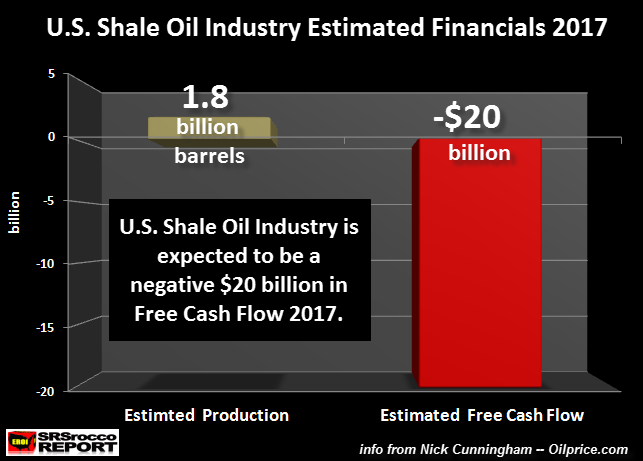
Well, it looks like the U.S. shale oil industry is going to chalk up another lousy year of financial losses in 2017. This shouldn’t be a surprise as the U.S. shale oil industry hasn’t made any real money since 2008. However, I still read articles suggesting that the United States will still become energy independent by ramping up its Mighty Shale Oil Machine.
Unfortunately, the country’s shale oil industry will never allow the United States to become energy independent, but it will sure go BROKE trying to do so.
According to the article by Nick Cunnigham, Is Wall Street Funding A Shale Failure, he made the following remarks:
Investors hungry for yield are throwing money into companies who then drill more, and the surge in production is hurting the industry as a whole. Despite efficiency improvements, the shale industry is expected to be cash flow negative by a combined $20 billion this year as oil prices sink.
….. Investors are slowly waking up to the idea that they may not be able to make juicy profits by betting on a sharp rebound in oil prices. There is some early evidence that Big Finance is pulling back, with new equity issuance down recently.
As Nick stated in his article, the U.S. shale oil industry is expected to tack on another $20 billion in NEGATIVE free cash flow. Thus, they spent another $20 billion more than they made in operating cash. If you have been reading my energy articles for the past several years, this is no surprise.
Looking at the chart below, I estimate the U.S. shale oil industry will produce about 5 million barrels of oil per day in 2017. This equals about 1.8 billion barrels for the year. In producing those 1.8 billion barrels of oil, the U.S. shale oil industry lost $20 billion. Yes, I know, its not a net income loss, rather it’s negative free cash flow. However, free cash flow is a better metric in determining the health of a company:

In order to stop the negative free cash flow hemorrhaging, the U.S. oil industry decided to cut back on its CAPEX (capital) spending. According to the EIA report, U.S. Oil Producers Paying Off Debt, But Higher Costs Restrict Cash Flow Growth:
From 2012 through the end of 2015, debt was a significant source of capital for the producers included in the analysis, with the addition of a cumulative $55.3 billion in net debt. Since the beginning of 2016, however, these producers have reduced debt by $1.4 billion.
So, the 58 public oil companies used in this analysis added $55.3 billion of debt from 2012 to 2015, but were able to pay down a net $1.4 billion in the past year? Does anyone else see something wrong here?? So, for three years, the U.S. oil companies added an average $18.4 billion in debt, but were able to pay down $1.4 billion in the past year??
Sure, we can give the oil industry some kudos for paying down some debt, but how long is it going to take just to pay down the $54 billion of debt added from 2012-2015?
Furthermore, to pay down that $1.4 billion in debt, the U.S. oil companies sold assets, sold shares and cut back on capital expenditures. This is not a good way to MAINTAIN or GROW production going forward. This is what I call the CANNIBALIZATION of the U.S. OIL INDUSTRY.
Lastly, another excellent article titled, America’s Firms Don’t Give A Frack About Financials, by an individual who is not suffering from BRAIN DAMAGE, stated the following:
Shale’s second coming is testament to Texan grit. But the industry’s never-say-die spirit may explain why it has done next to nothing about its dire finances. The business has burned up cash for 34 of the last 40 quarters, according to figures on the top 60 listed E&P firms collected by Bloomberg, a data provider. With the exception of airlines, Chinese state enterprises and Silicon Valley unicorns—private firms valued at more than $1bn—shale firms are on an unparalleled money-losing streak. About $11bn was torched in the latest quarter, as capital expenditures exceeded cashflows. The cash-burn rate may well rise again this year.
But the fact that the industry makes huge accounting losses has not changed. It has burned up cash whether the oil price was at $100, as in 2014, or at about $50, as it was during the past three months. The biggest 60 firms in aggregate have used up $9bn per quarter on average for the past five years. As a result the industry has barely improved its finances despite raising $70bn of equity since 2014. Much of the new money got swallowed up by losses, so total debt remains high, at just over $200bn.
So, the biggest 60 U.S. energy firms burned an average $9 billion in cash each quarter for the past five years… even at $100 a barrel oil. At some point, investors and the market will need to wake up and realize that Shale Energy was nice while it lasted, but it was just another PONZI SCHEME.
