The main events today are the meeting of the UK Cabinet of Ministers, at which it is planned to vote on the draft of the Agreement on the country's withdrawal from the EU. The outcome of this meeting can greatly affect market sentiment. In the case of a positive vote, the British currency will receive a strong growth momentum, which will allow the GBP/USD quotes to beat up resistance around 1.3035 and rush to the area of 1.3150. Otherwise (I believe that the probability of this option is anyhow higher), the pair will start moving towards the minimum marks of the current year below 1.2700. The probability of such a scenario is indicated by the dynamics of quotations in the first hours of Wednesday. After a sharp rise in prices in the second half of yesterday, caused by the news on the harmonization of the draft agreement on Brexit, as a result of which the quotes of the GBP/USD pair rose by almost 180 points, breaking through the 1.3000 mark by the end of the day, today there is a gradual slipping down. As it was repeatedly noted in previous overviews, for a correct conclusion about the end of the negative dynamics in this pair, it is necessary to wait for the test of the minimum annual prices and monitor the process of forming corrective signals.
Today from the published statistics, the data block on consumer inflation in the United States in October will have a significant impact on the dynamics of the markets. In the case of strong statistics, the mood of the players at higher rates of monetary tightening of the Fed will grow stronger, which will play in favor of the US dollar.
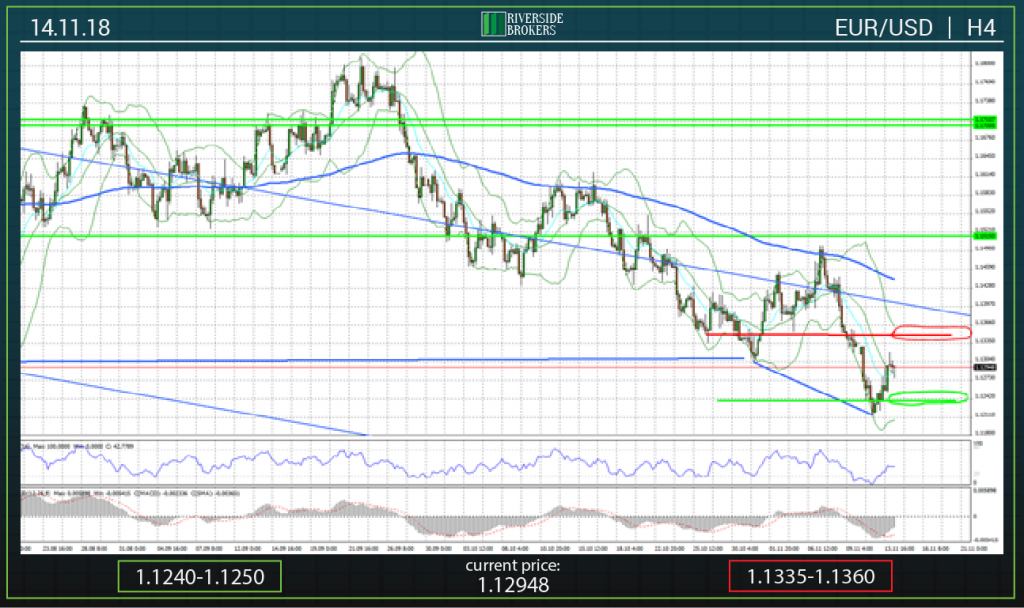
Positive news on Brexit allowed the pair EUR/USD on Tuesday to continue the rebound from the area of annual minimums. On the daily timeframe, we continue to observe the process of formation of convergence between local price minima and the corresponding values of the MACD indicator. Depending on the outcome of this process, it will be possible to say with greater confidence about the end of the period for the strengthening of the US dollar, or, in the event of a break in the signal, the pair may continue moving south for some time.
Support and resistance zones are today located in areas 1.1240-1.1250 and 1.1335-1.1360, respectively.
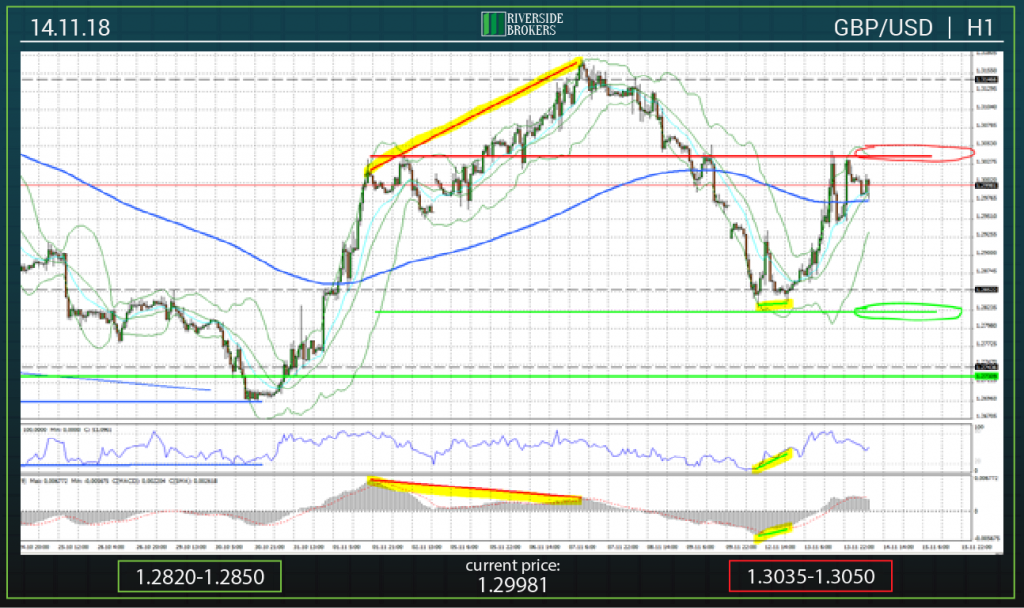
The announcement that the preliminary text of the Agreement on the UK's exit from the EU is agreed, led to a rapid rise in quotations of the GBP/USD pair, which managed to break the 1.3000 mark by the end of yesterday's trading. Today there is a downward correctional movement, which is caused by players' concerns about the outcome of the UK cabinet ministers vote. As it is known, there are several ministers in the government who disagree with the draft agreement proposed by Theresa May. Depending on the voting results, the GBP/USD pair will make sharp fluctuations in quotations. This situation is reflected in the graph with a wide range between the support and resistance zones, the distance between which is about 200 points.
Today is published a large block of statistics on inflation in the UK for October. However, in my opinion, the impact of this factor will have on the dynamics of quotations only a short-term impact, since all the attention of participants today is focused on the government meeting on the Brexit issue.
The support zone today is in the area of 1.2820-1.2850 (green oval).
The resistance zone is present in the range 1.3035-1.3050 (red oval).
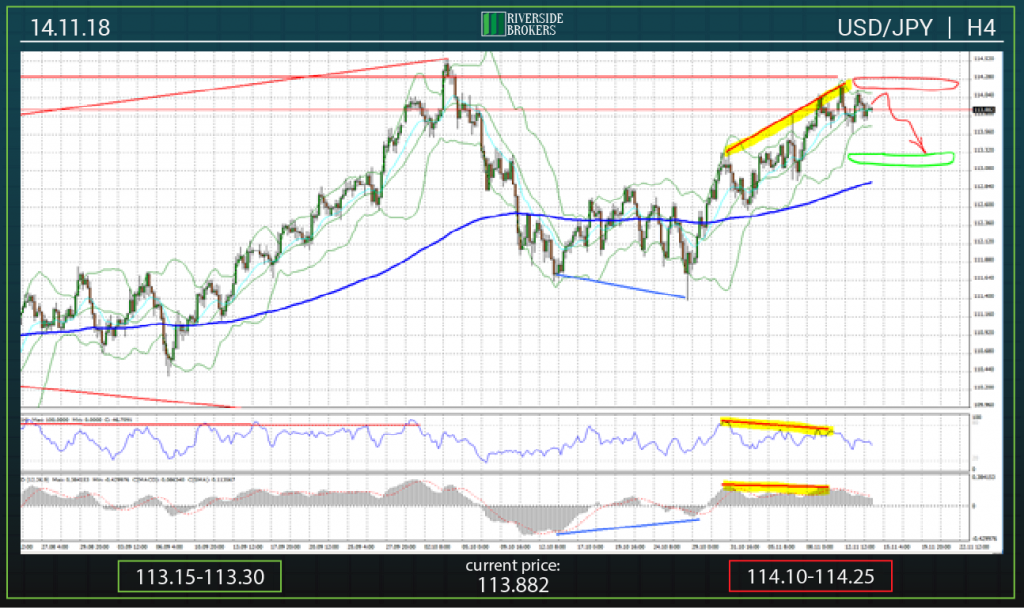
The technical picture of USD/JPY has not changed. On the H4 timeframe, there is still a correction signal of divergence between the local highs of quotations and the corresponding values of the RSI and MACD indicators, which suggests a decline in prices. At the same time, as noted in yesterday's overview, for medium-term prediction, it is necessary to wait for prices to reach maximum values in the range of 114.40-114.55 and to monitor the possibility of divergence on the daily time frame.
The support zone today is the range 113.15-113.30 (green oval).
The zone of resistance is located in the area of 114.10-114.25 (red oval).
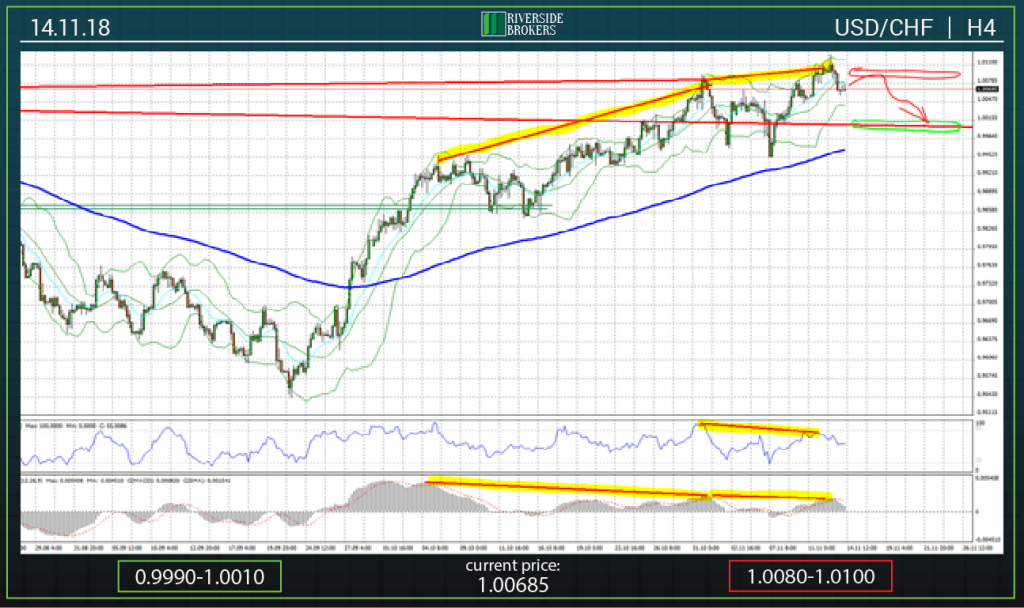
In the pair USD/CHF the situation is unchanged. The correction signal is still observed on the chart - a divergence between the price peaks and the values of the RSI and MACD indicators, which implies the probability of negative price dynamics. In the previous article it was stated that the aim of the decline is the parity mark. In the future, prices may fall to its 200-periodic MA, located about 0.9940.
The support zone is present in the area of 0.9990-1.0010 (green oval).
Resistance is still the range 1.0080-1.0100 (red oval).
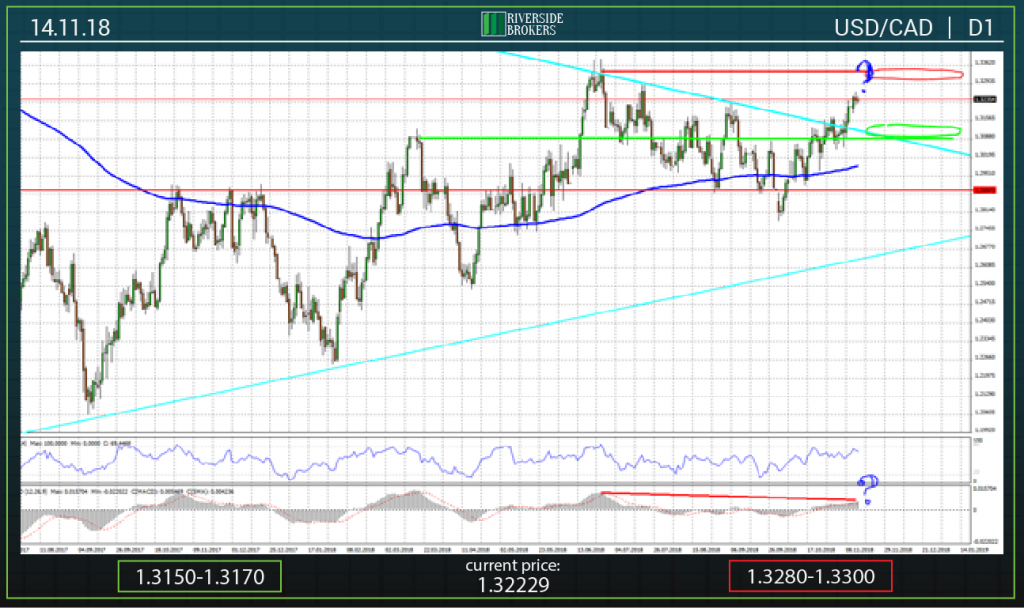
The situation in the pair USD/CAD is similar to the previous pairs of this overview: USD/JPY and USD/CHF. On time frames H1 and H4, a set of corrective signals is observed - divergences between local maximums of quotations and RSI and MACD indicator values. As noted in yesterday's overview, it is now necessary to wait for the formation of a similar signal on the daily time frame. This will be possible when quotes reach the area of maximum prices observed in the period June 20-28 of the current year (around 1.3300). The remaining uncertainty of the situation is still marked on the chart with question marks.
Support today is in the area of 1.3150-1.3170 (green oval).
The resistance is located at 1.3280-1.3300 (red oval).
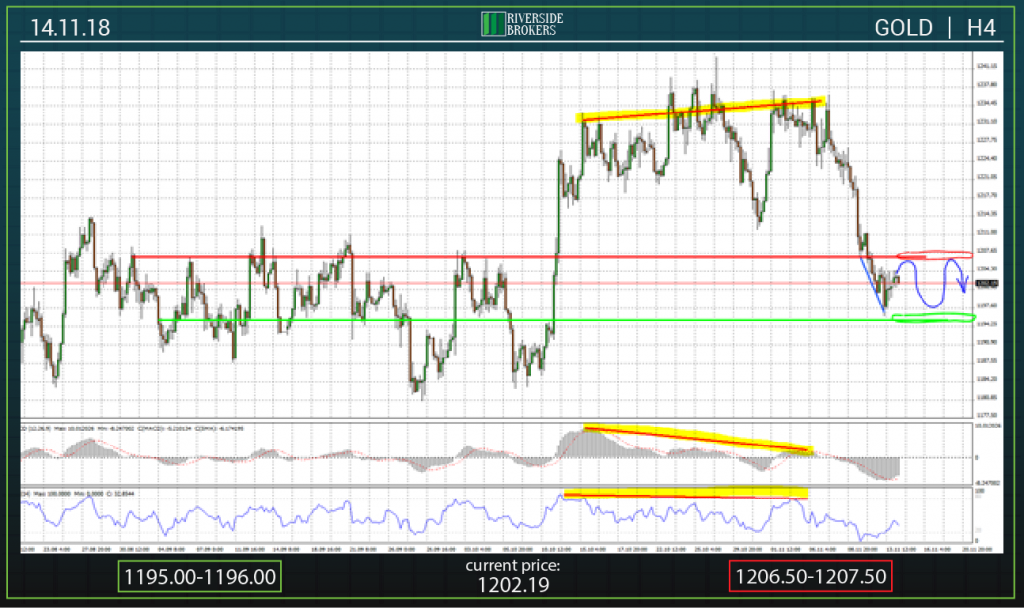
On Tuesday, gold prices briefly broke the mark of 1200.00. However, in the second half of the day, prices were able to gain a foothold in the area above this mark. As a result of the decline in quotations in the last few days, gold approached the upper limit of the well-traded medium-term range 1195.00-1205.00, which indicates the probability of stabilization of the situation.Today it is assumed neutral price dynamics.
The support zone today is located in the area of 1195.00-1196.00 (green oval).
Resistance is present in the range 1206.50-1207.50 (red oval).
