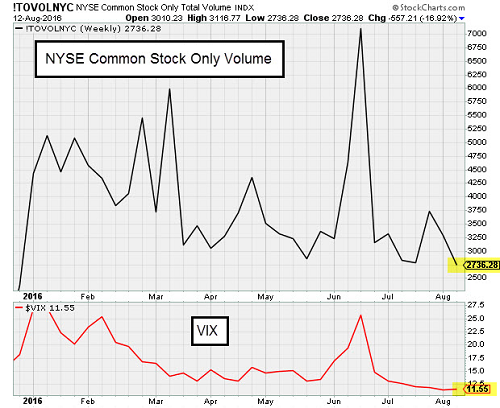
Volumes show it. Sentiment reflects it. Major index trading ranges are very narrow. But don’t let the headlines lull you into drowsiness because while this leopard sleeps, its next meal is being planned. And even though portfolio managers may be invisible to the office this month, they are also planning moves today to help their clients and put them in a better spot to win their year-end performance bonuses. You can see the risk appetite increasing in the markets across nearly every asset class. The economic data looks fair and the Fed should remain on hold with global rates continuing to fall. Appetite for M&A, IPOs and secondaries looks healthy. And whether or not you like it, the U.S. Presidential race looks like a done deal. So safe assets are not likely going to be rewarded into year end, especially if you promised your pensioners that you will return 7-8%. If you are a billionaire and don’t mind missing an up move, then find a log and take a nap. But for the rest of us, it is time to fish and hunt.
Volumes Are Dead
Last week was the slowest week of 2016.
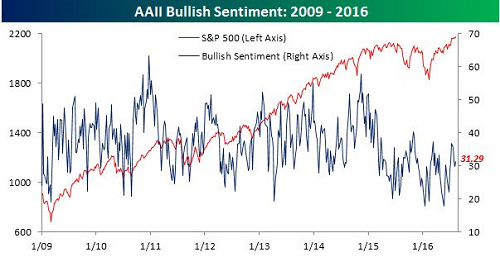
Individual investor sentiment is also bored:
@bespokeinvest: Bullish sentiment has been below 40% for a record 41 straight weeks and 75 of last 76.
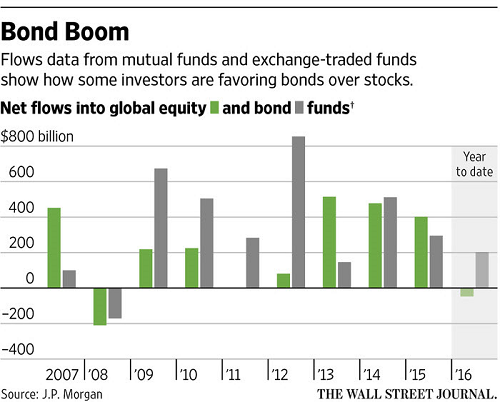
Even the fund flow data shows the lack of excitement in Equities. All the interest remains in Bonds:
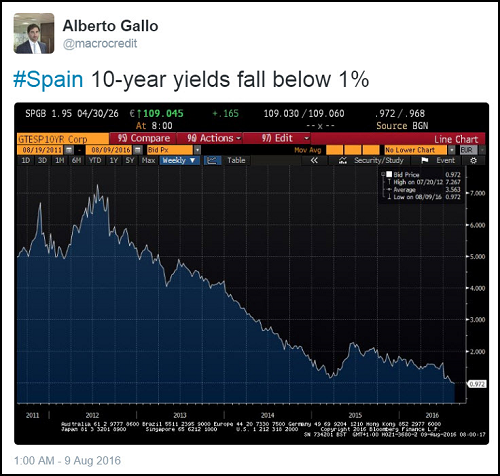
Speaking of Bonds: Spanish 10-year yields, which were toxic four years ago, are now trading at less than 1%:
And the value of negative yielding bonds moves to a record level carrying everything else with it:
The value of negative-yielding bonds swelled to $13.4tn this week, as negative interest rates and central bank bond buying ripple through the debt market.
The universe of sub-zero yielding debt — primarily government bonds in Europe and Japan but also a mounting number of highly-rated corporate bonds — has grown from $13.1tn last week, according to figures compiled by Tradeweb for the Financial Times.
“It’s surreal,” said Gregory Peters, senior investment officer at Prudential (LON:PRU) Fixed Income. “It’s clear that central banks are dominating markets. There’s a race to the bottom. Central banks are the main drivers of this, it’s not fundamental.”
The New Zealand central bank became the latest to cut interest rates again, while the Bank of England recently restarted its quantitative easing programme to combat the economic slowdown that is expected to follow the UK’s vote to leave the EU. About a quarter of the global economy now has negative interest rates.
That has further squashed bond yields, and forced investors to scurry into emerging markets, junk bonds and ultra-long dated government debt to snap up what little remains of potential returns. Money is also spilling into the global stock market, helping the FTSE All-World index to a 5.3 per cent gain this year and pushing all three main US equity indices to a “trifecta” of fresh records this week.
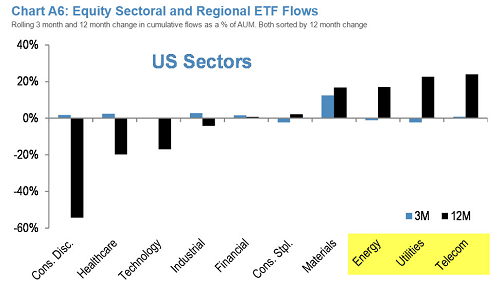
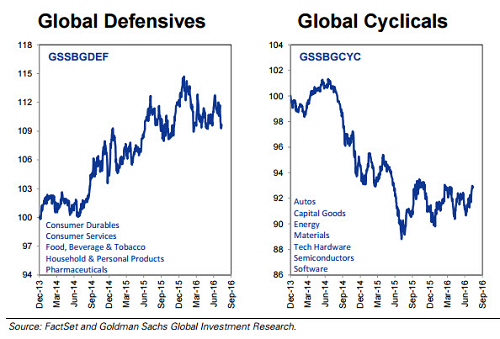
Plunging interest rates combined with economic worries has led to the below surge in Defensive sector fund flows:
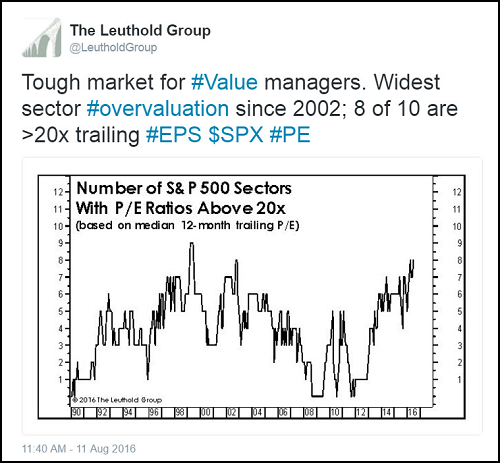
The Leuthold Group illustrates other periods of Defensive stock overvaluation:
“Eight of ten S&P sectors now trade above 20x trailing EPS, representing the broadest sector overvaluation since 2002. There were a few months during 1999 in which only the Utilities sector traded below a 20x multiple. In 2016, of course, that sector’s combination of low volatility and yield earns it a P/E of 22x—in line with the S&P 500 median. The positive side of this revolting development is that Growth managers can finally buy Utilities.“
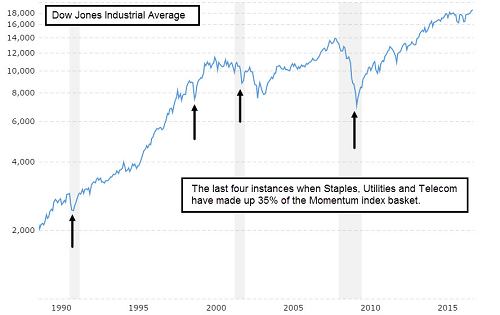
Barron’s also noted the extreme level of Defensive stocks making up the market’s Momentum index:
The S&P 500 traded at a new high last Thursday, continuing a streak of records that began when it finally broke its May 2015 peak on July 11. Since that old high, however, the market’s outperformers have been its safest stocks—utilities, telecommunication companies, and consumer staples. That’s particularly apparent when looking at the top gainers over the past 12 months. More than 30% of the 100 best-performing equities in the Russell 1000—a group known as “high momentum” stocks—come from defensive sectors. That level has been breached just five times since 1990.
Momentum and safety, however, are strange bedfellows—and their pairing doesn’t tend to last. While that could be bad news for investors in utilities, staples, and telecoms, it has historically been great news for the stock market.
If this is a bad sign, then I want to BUY it:
Just looking at the two charts below, one can see the Defensives getting tired while the Cyclicals look much more interesting to buy:
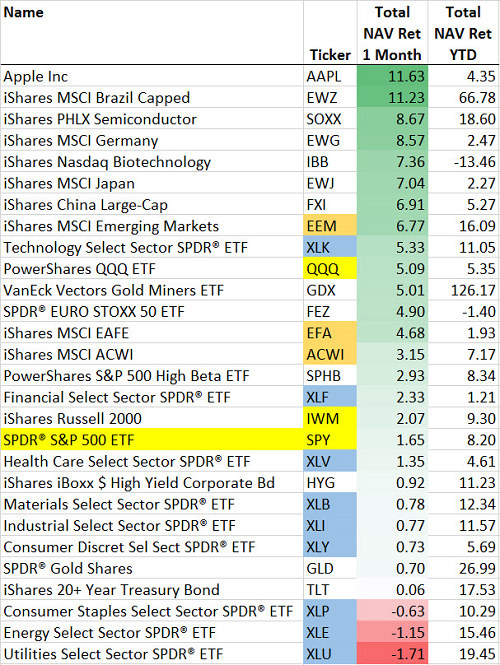
And so lots of yawns in the last month over the +1.6% move in the S&P 500 as the VIX falls below 12:
But look under the surface. Some really good returns have been made in Technology, Biotech, Small Cap, Emerging Int’l and Developed Int’l equities.
As department store retail declines, even Macy’s has now become a real estate play:
Macy’s (NYSE:M) is closing 100 stores as the company tries to right its ship in a world where department stores continue to see weak mall traffic and face rising competition from online retailers.
Macy’s, which has a current portfolio of 728 stores, said it expects most of the stores will close in early 2017 and said it will disclose the locations at a later date. The move comes as the value of the real estate exceeds its value as a retail store.
The Ohio-based company had previously come under pressure from activist investors to unlock value from its vast property holdings. The department store, which also owns Bloomingdales, has also been exploring a “partnership or joint venture transactions involving the company’s flagship and mall-based properties.”
One of the hottest areas of the REIT sector has been self-storage, but even too much capital can have a dampening effect on returns. Public Storage (NYSE:PSA) is the giant with 2,000+ properties and they believe the industry is adding supply at a 20% rate:
Occupancy growth stalled with top markets full. Although Internet searches were up, customer conversions slowed. As a result, some REITs increased promotions and cut rates. There’s also a burgeoning concern of some rate growth fatigue from existing customers in select markets with strong rate growth over the past couple of years. At the same time, expense growth is picking-up, driven by higher property taxes. Supply continues to grow and is up roughly ~20% over the last 12 months according to PSA. The weakest markets included Houston, Austin, Denver & Chicago.
(Bank of America/Merrill Lynch)
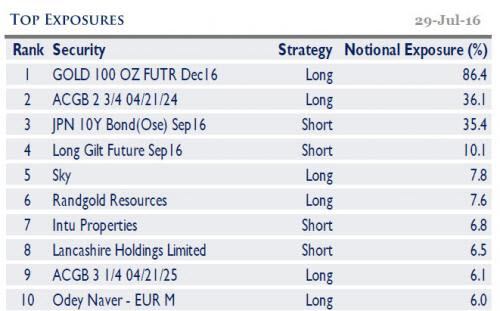
An interesting portfolio from one of the industry hedge fund legends:
Pretty certain that I would have to rename my fund “Smaug” if I was running an 86% gold position.
For portfolio managers of all styles, the lack of returns is hitting pocketbooks across the board:
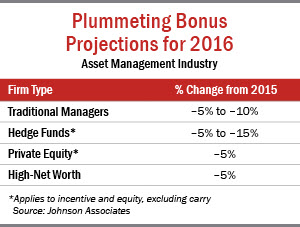
Outflows and fee pressure have cast a dark shadow over earnings season in the asset management business and that gloomy outlook is expected to hit bonuses for firms of all stripes, according to forecasts from compensation consultant Johnson Associates.
Traditional asset managers should see their incentive-based compensation fall between 5% to 10% from 2015 levels while hedge fund staff bonuses are expected to dwindle by 5% to 15%, according to Johnson Associates.
Those disappointing numbers are a continuation of a trend that started last year in the traditional space and in 2013 for hedge funds. What’s new is the forecast of a reversal for private equity managers, where bonuses have steadily risen since 2011. But this year, Johnson Associates is forecasting a 5% decrease in incentive-based pay at PE firms.
The decline in Asset Manager compensation could explain why Aspen’s real estate market has hit a bump in the trail:
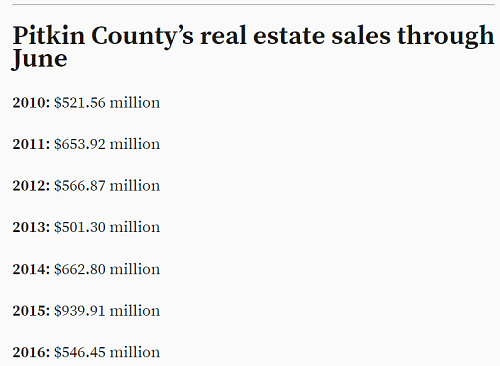
The summer crowds are dense in Aspen. Sales tax revenues are soaring. Lodging occupancy is high. So why is Aspen’s high-end real estate market — one of the most robust in the country, with dozens of options for buyers ready to spend more than $10 million — in its first-ever sustained nosedive?
High-end sales that fuel Aspen’s $2 billion-a-year real estate market are evaporating, pushing Pitkin County’s sales volume down more than 42 percent to $546.45 million for the first half of the year from $939.91 million in the same period of 2015.
Finally, few knew his face, but everyone knew his costume:
The information presented here is for informational purposes only, and this document is not to be construed as an offer to sell, or the solicitation of an offer to buy, securities. Some investments are not suitable for all investors, and there can be no assurance that any investment strategy will be successful. The hyperlinks included in this message provide direct access to other Internet resources, including Web sites. While we believe this information to be from reliable sources, 361 Capital is not responsible for the accuracy or content of information contained in these sites. Although we make every effort to ensure these links are accurate, up to date and relevant, we cannot take responsibility for pages maintained by external providers. The views expressed by these external providers on their own Web pages or on external sites they link to are not necessarily those of 361 Capital.

