Yesterday, the dynamics of quotations was influenced by the expectations of the results from the British government meeting on the Brexit issue. As it became known in the evening, Prime Minister Theresa May anyhow managed to achieve positive voting results on the proposed Draft-Agreement on the country's withdrawal from the EU. Nevertheless, 11 out of 29 ministers did not support this decision, which indicates a split in the establishment and indicates significant difficulties by voting in the British Parliament. The main obstacle to achieving “soft” Brexit is the question about the Irish border, which, anyway, still has not been resolved. The parties simply postponed this issue until July 1, 2020. At the same time, as it became known from the Draft-Agreement, the UK retains all the responsibilities toward the EU, losing own right to participate in the making any of the European decisions. Supporters of the country's withdrawal from the EU, participating in a referendum, hardly wanted such a scenario. Thus, the supporters of the" hard " Brexit received significant trumps, which can allow them to vote down in Parliament. All the difficulties in this long-playing process are still ahead.
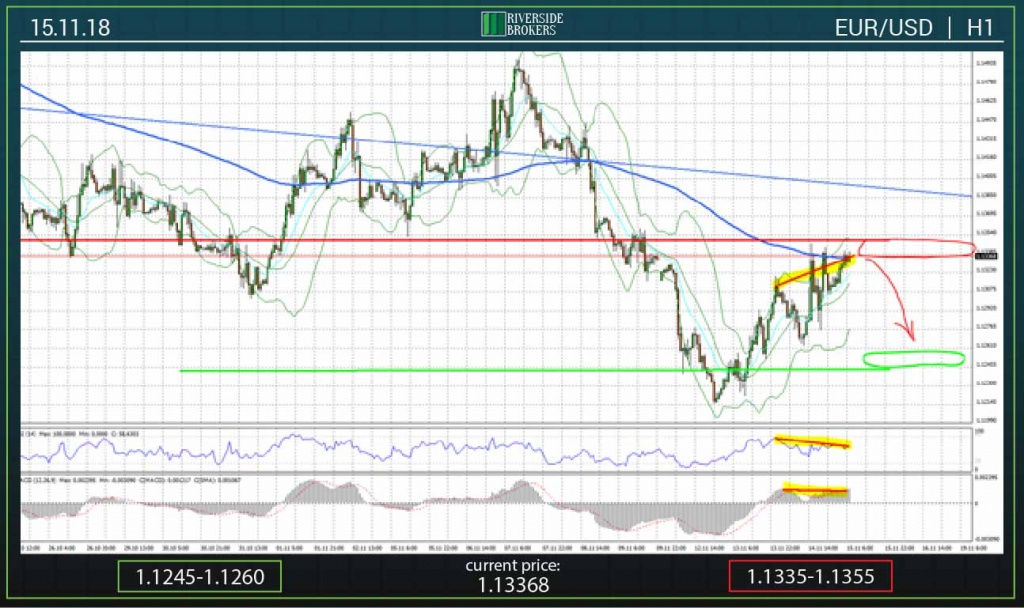
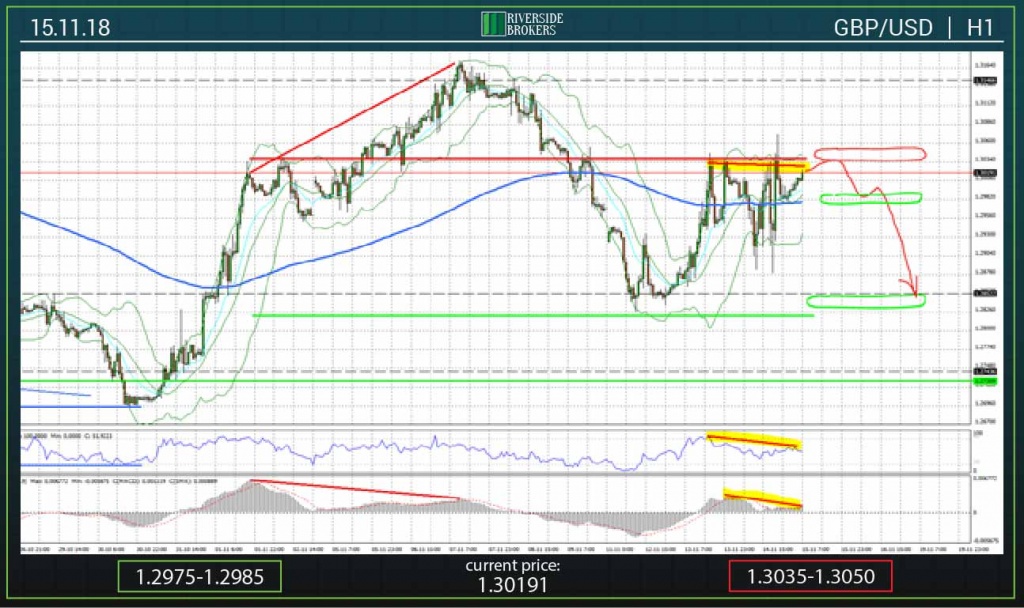
The reaction of the market to news of positive results from the vote of the Cabinet of Ministers was rather restrained. The markets made the main movement earlier. At the same time, attention is drawn to the fact that the positive dynamics of quotations of EUR/USD and GBP/USD pairs was accompanied by the formation of a number of corrective signals on the hourly time frame - divergences between local price highs and the values of the RSI and MACD indicators. Based on this, it can be assumed that today the local weakening of the US dollar in these pairs can not only stop, but also change to the opposite movement.
The tendency to strengthen the dollar can be supported today by published statistics on retail sales in the United States and the statement of Fed Chairman Jerome Powell, who once again confirms his commitment to further tightening of the monetary policy.
EUR/USD
The positive expectation of the results from the vote of UK Government about Brexit led the EUR/USD quotes above the 1.1300 mark. On Thursday morning, prices reached the range of 1.1330-1.1345. However, as noted above, the growth dynamics of quotations is accompanied by the formation of a divergence between the price maxima and the corresponding values of the RSI and MACD indicators on the hourly time frame. This fact indicates a high probability of a turnaround in the market and the beginning of a decline in prices. Today, the speech of Jerome Powell, which can give an additional negative impetus to the European currency, will be important for this pair.
Zones of support and resistance today are in areas 1.1245-1.1260 and 1.1335-1.1355, respectively.
GBP/USD
Yesterday trading pair GBP/USD was very volatile, which is explained by the expectation for the results of the vote from the Cabinet of Ministers on the draft agreement on the country's withdrawal from the European Union, proposed by Theresa May. As it became known from the text of the draft, the main obstacle is the issue of the Irish border that has not been resolved yet. The solution of the problem was simply postponed till the July of 2020. This circumstance indicates the probably strong opposition to this Agreement in the country's parliament. The threat of voting failure is a strong negative factor for the British currency. Despite the rise in prices on Wednesday, from a technical point of view, the chart formed a divergence between the highs of prices and the values of the RSI and MACD indicators. Based on this, today is predicted decline in prices. The first support is the 200-period MA on the hourly time frame, located near the 1.2980 mark. In case of its breakdown, the pair has every chance of increasing the rate of decline until reaching the next support in the area of 1.2820-1.2850.
The support zone is subsequently located in areas 1.2975-1.2985 and 1.2820-1.2850 (green ovals).
The resistance zone is in the range 1.3035-1.3050 (red oval).
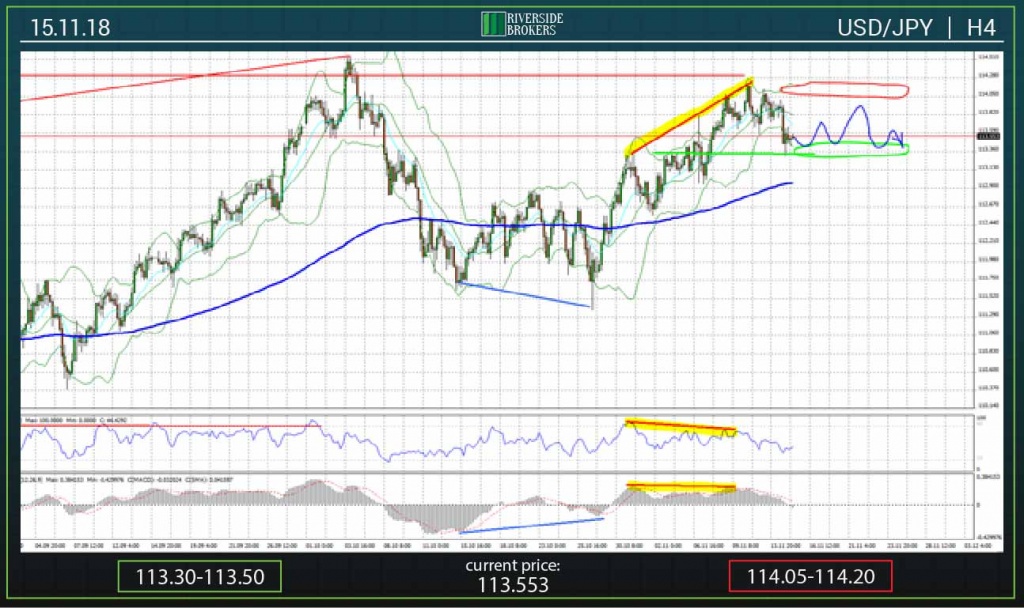
On Wednesday, the realization of the correction signal was recorded - a divergence between the local maxima of the quotes and the corresponding values of the RSI and MACD indicators. Prices USD/JPY pushed down from the level of 114.00 and declined to the area of 113.50-113.60. It should be noted that it is this range in which immediate vicinity is located local support. Today is predicted the side dynamics of quotations.
The support zone is the range 113.30-113.50 (green oval).
The zone of resistance is located in the region of 114.05-114.20 (red oval).
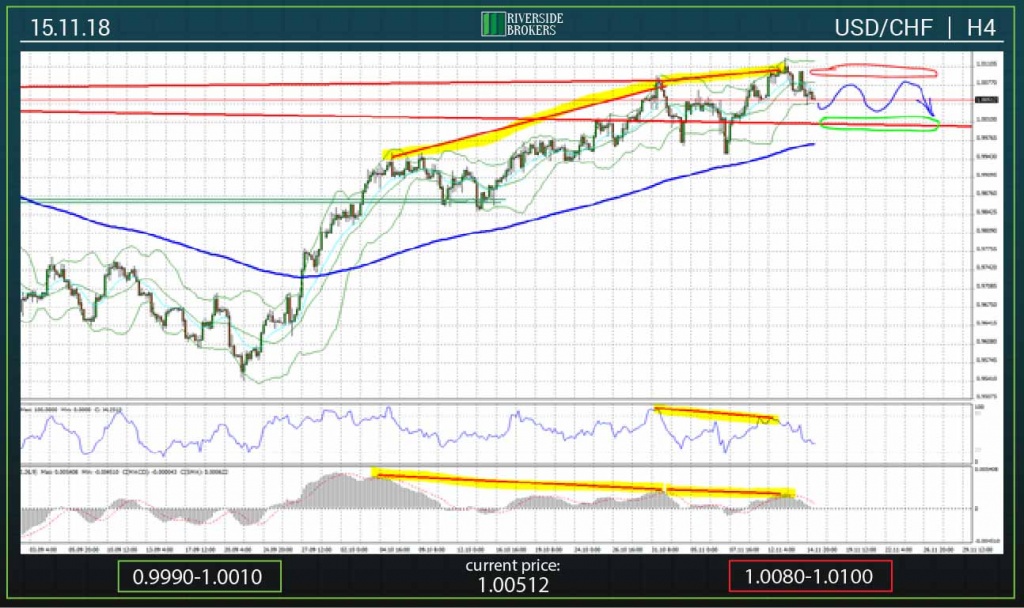
In the pair USD/CHF today, the quotes are expected to drop to parity, after which the situation will stabilize. The set of correction signals - the divergences between the price maxima and the values of the RSI and MACD indicators, observed since October 4 of the current year, should get its realization.
The support zone is present in the area of 0.9990-1.0010 (green oval).
Resistance is still the range 1.0080-1.0100 (red oval).
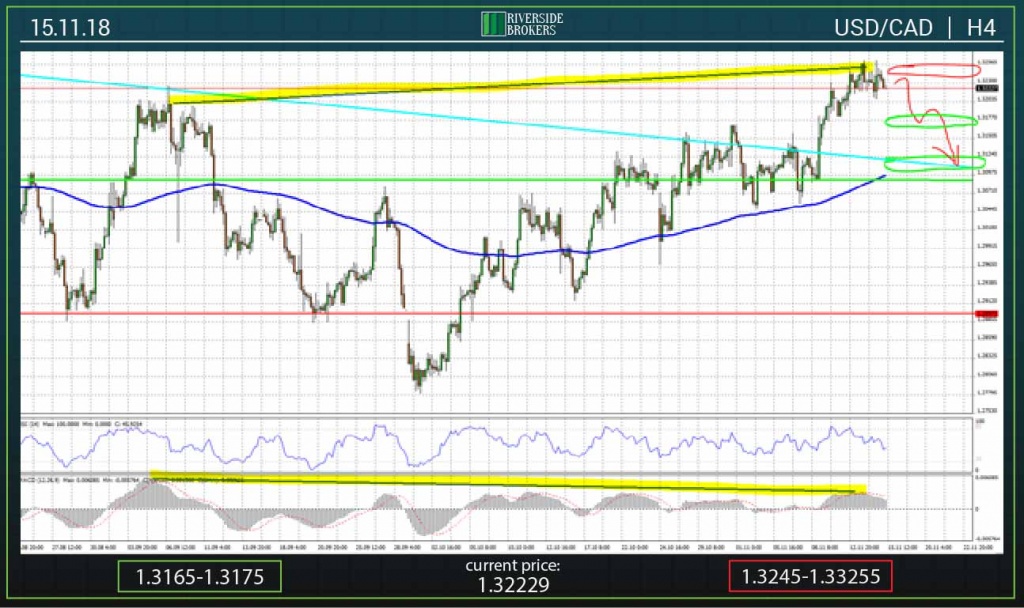
The situation in the USD/CAD pair of the trading results on Wednesday has not changed. It is necessary to wait for the implementation of a set of corrective signals – divergences between the local maxima of quotations and the values of the RSI and MACD indicators, which implies a strengthening of the Canadian dollar relative to its American counterpart. Support zones are highlighted on the graph with green ovals. The first of these zones is the area of maximum prices in the period from September 4 to 11 of the current year. The second support is located on the upper border of the multi-year triangle (the blue line on the chart).
Support today is consistently in the areas of 1.3165-1.3175 and 1.3100-1.3120 (green ovals).
Resistance is located at 1.3245-1.33255 (red oval).
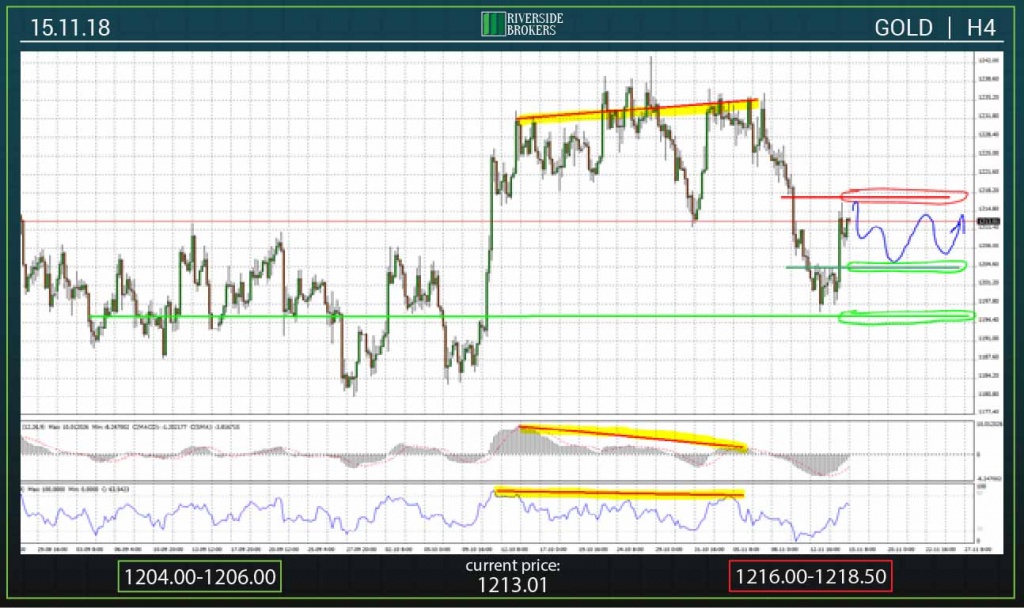
On Wednesday, gold quotes pushed up from the 1200.00 mark, reaching 1213.00-1215.00 mark by Thursday morning. At the same time, the growth dynamics of prices is accompanied on the M15 time frame by the formation of a divergence between the maximum price values on November 14 at 21:00, November 15 at 11:00 and the corresponding values of the RSI and MACD indicators. Based on this, it is assumed that quotations will return to the range of 1200.00-1205.00.
The support zone today is located in areas 1204.00-1206.00 and 1195.00-1196.00 (green ovals).
Resistance is in the range of 1216.00-1218.50 (red oval).
