Pay No Attention to the Man Behind the Curtain…
One of the advantages of starting out as a hedge fund-of-funds shop is that we happen to have a fair amount of expertise in evaluating asset managers of all stripes. And while we can’t put an exact number on the percentage of asset management firms that generate true alpha with any consistency, we do know that it’s a small percentage of the universe of available managers. Such a statement is hardly controversial as it relates to the mutual fund business, where scores of studies have, to one degree or another, demonstrated that fact. But when directed at hedge funds, there seems to be more resistance.
Merely running a hedge fund seems to confer upon the portfolio manager superior intellect, insight and skill — we hear he is a whiz of a wiz, if ever a wiz there was. With over 7,500 hedge funds in the HFR database alone, clearly that cannot be true. Even if we allow for the fact that a handful of the top hedge fund shops do have the resources to lure top talent away from the mutual fund industry, we’re talking about a fraction of the hedge fund universe, a number we’d put in the low single digits based on our experience. But do we have any proof that the average hedge fund is no better than the average mutual fund?
As reported recently by Bloomberg, researchers Mila Getmansky of the University of Massachusetts Amherst, Andrew Lo of the Massachusetts Institute of Technology and Peter Lee of Lo’s firm AlphaSimplex Group, determined that due to well-known, self-reporting biases, hedge fund performance was overstated by a factor of two from 1996 through 2014. This brought the average annualized return down from 12.6% to 6.3%. Now, as we’ve written in the past, we are loath to draw any conclusions about the performance of “hedge funds” as a group. However, we couldn’t help but notice that the 6.3% average annualized return would fall almost exactly in the middle of the performance of all the major mutual fund category averages over the same time period. Scientific? Perhaps not. Compelling? We think so. Of course, we’d be remiss if we didn’t acknowledge that the mutual fund category averages also suffer from certain biases, as mentioned in our “Education” section below, but the big problem of self-reporting isn’t one of them.
Liquid alternatives are proliferating because they are valuable additions to the tool kits utilized by advisors when building robust portfolios. It is increasingly understood that many – not all – but many strategies traditionally run within hedge fund vehicles can be run seamlessly inside of ’40 Act funds. And in doing so, investors benefit from greater regulatory protection, greater transparency, greater liquidity and lower fees. Of course, we’re biased, so take a look behind the curtain and come to your own conclusions.
Liquid Alts Corner
The Data
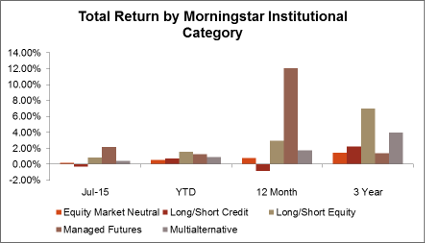
Alternatives fared much better in July than they did in June, as all but long/short credit posted positive returns. Managed futures posted the strongest returns, as appreciation of the U.S. dollar combined with a continued slide in oil and other commodity prices created opportunities for trend-followers to profit. Year to date, all major categories continue to be rather flat, with long/short equity being the top performer, albeit with a mere 1.6% return. Longer term, long/short equity continues to be the winner, with a nearly 7% annualized return over the last three years. Despite strong performance over the last 12 months (a gain of over 12%), managed futures continued to be the worst performing category on a longer term basis, gaining just 1.4% annually over the previous three years.

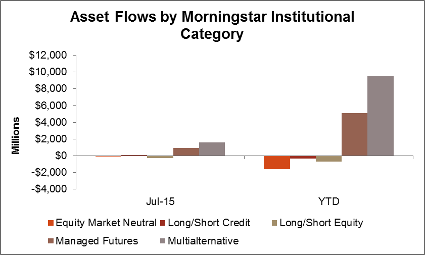
Multialternative and Managed Futures funds continue to be the primary source of flows among alternative mutual funds. Multialternative saw another $1.6 billion of net inflows during July, bringing their year-to-date total to $14.5 billion. Managed Futures funds had nearly $1 billion in inflows and have now brought in more than $5 billion so far in 2015. Long/Short Equity saw the largest outflows, as the category lost more than $300 million in assets during the month. Once again, the outflows in the category were dominated by one fund that lost more than $400 million during the month, bringing its 12-month net outflows to more than $13 billion.
Alternatives In The News
Change of Fortune
It appears Claren Road, a long-short credit hedge fund backed by the Carlyle Group (NASDAQ:CG), has seen quite a change in fortune over the last 12 months. Just a year ago, the fund was turning potential investments away. But after large losses in October 2014, followed by a negative first half in 2015, investors seem to have changed their tune. The fund’s assets peaked at $8.5 billion in September 2014, but it is expected the fund will be managing roughly $2.1 billion come October 1 and may be shut down.
Pain in Pseudo-Alt Land
What is “alternative” and what is not may be debatable. In any event, labels are silent on the merits of any particular investment. But MLPs, which some advisors throw into the “alt” bucket, have been hit hard. The never shy Josh Brown noticed and had a few choice words for those using MLPs as bond replacements.
Education
Biased Data
As mentioned in the introduction, a recent study showed that when adjusted for two prominent biases, hedge fund returns for the last two decades may only be half of what was reported. In this study, they looked at two of the most prominent types of biases: survivorship bias and backfill bias. With most hedge fund databases, these biases can be extreme, as the results indicate. This is largely due to the self-reporting nature of hedge fund databases.
It doesn’t take much of a thought experiment to highlight the huge inherent biases that self-reporting creates. Few hedge funds begin reporting to databases right away. Instead, they build up a track record, and if they feel that track record is appealing to potential investors, only then will they report it. Unlike mutual fund databases that track all registered funds from day one, many hedge fund databases allow funds to report their historical performance upon initial submission. It’s unlikely that many funds that get off to a poor or mediocre start will decide it’s worth reporting their numbers. Much more likely is that funds that get off to a great start will be inclined to do so. This “backfill” bias then impacts the overall hedge fund database in two ways: by excluding poorly performing hedge funds by omission and by including those with historically strong performance. Both of these situations inflate publicly disclosed performance relative to real world experience.
A second impactful bias is known as “survivorship” bias. To be fair, this bias actually shows up everywhere, including in more traditional and vetted databases, such as Morningstar. (Due to space limitations, we’ll save that discussion for next month.) However, it can be particularly nasty when it comes to hedge fund databases that rely on managers to self-report their performance. A recent example highlights the problem quite clearly. In January 2015, many hedge funds were short the Swiss franc, leading to large losses when the Franc spiked mid-month. One such fund with a strong 25-year track record was essentially wiped out. However, in one of the more popular hedge fund databases, that fund’s track record ends in December 2014, leaving off the nearly 100% loss experienced by investors. The end effect of this is that hedge fund indices based on this database substantially overstated performance for the month. While this is a somewhat extreme example, it’s not uncommon. As we mentioned earlier, the difference between reported index returns and “bias-free” returns was a staggering 6.3% per year over an 18-year period.
As we have stated repeatedly, an investor must understand what drives the performance of potential investments. This is true at the fund level, but also at the index level, as indices are often used as proxies where actual fund data is sparse. So what’s the moral of the story? There are no shortcuts when doing due diligence on alternative investments. A true understanding of the strategies, funds and even indices is needed in order to make informed decisions.
Disclaimer: The information presented here is for informational purposes only, and this document is not to be construed as an offer to sell, or the solicitation of an offer to buy, securities. Some investments are not suitable for all investors, and there can be no assurance that any investment strategy will be successful. The hyperlinks included in this message provide direct access to other Internet resources, including Web sites. While we believe this information to be from reliable sources, 361 Capital is not responsible for the accuracy or content of information contained in these sites. Although we make every effort to ensure these links are accurate, up to date and relevant, we cannot take responsibility for pages maintained by external providers. The views expressed by these external providers on their own Web pages or on external sites they link to are not necessarily those of 361 Capital.
