I turned tactically bullish this morning, suggesting buying the ASX 200 earlier at 4904. This trade looked compelling given the oversold nature of the technicals, while the market internals had provided a strong contrarian buy signal.
This idea seems to have got off on the right foot, although there has been no real conviction in the buying and moves in Asia are fairly bearish with the Nikkei underperforming. As suggested yesterday, if the Federal Reserve are going to try to subdue volatility, then the Nikkei should underperform given the downside risks to USD/JPY.
Traders faded the rally in the ASX 200 from an intra-day high of 4969 and this again shows that market players just aren’t happy to bid up the market, especially with the madness likely to be seen on Thursday morning (AEDT). Once again, keep your friends close and your stops closer.
The overriding feel I am getting is that traders want to buy risks assets again, but they are too concerned about being long in a market where traders genuinely inherit a belief of a policy mistake from the Federal Reserve. High yield continues to deteriorate, with the poster child of the high yield space – the N:HYG and N:JNK ETF – both under further pressure despite oil stabilising. I would argue that more rational heads are prevailing and there has been a marked pick up in rhetoric that the moves in high yield and the gating of redemptions are widely different from 2007. Many have focused on the fact that the quality of the Third Avenue Fund in question was poor, with some 30% of bonds not even rated by the likes of S&P.
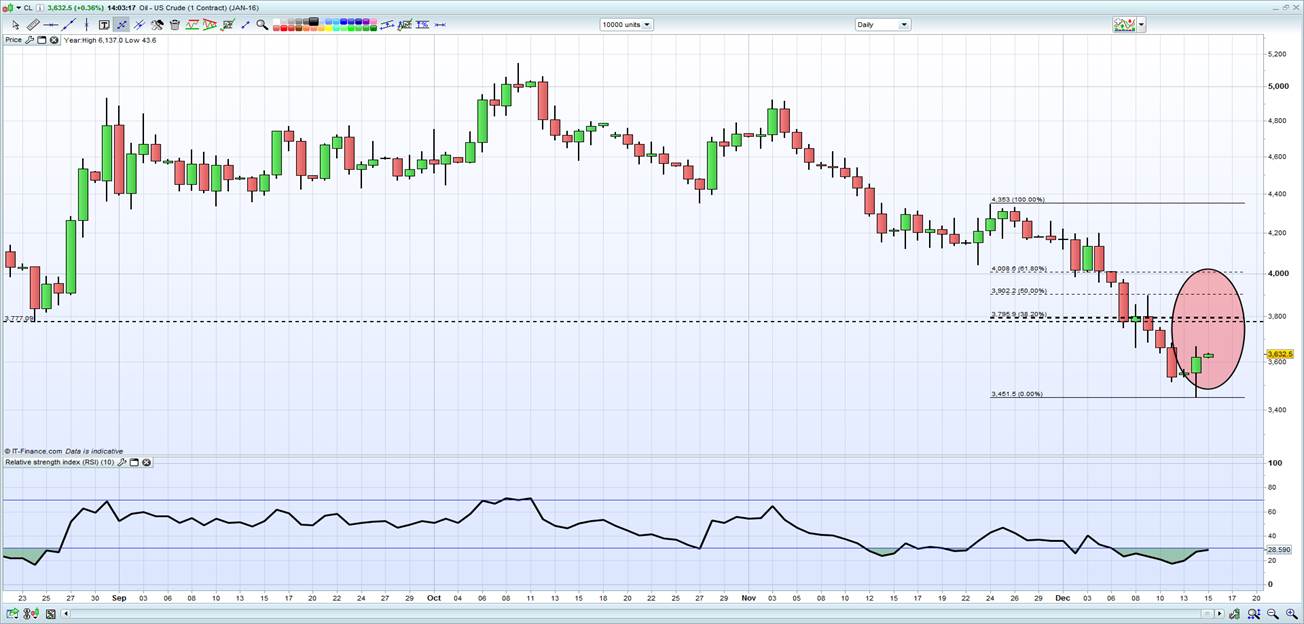
Oil remains key here and it is now fully understood by all in the market that falls in oil are not good. Oil is a buy in my opinion and I would be proven wrong on a break of yesterday’s low of $34.53. This view fits into my short-term risk on mentality. I’m keen to see if traders look to fade the commodity into the $37.76 to $37.94 area (the 24 August low and 38.2% retracement of the bear market selloff from 24 November – marked in red). An upside break of this level and I would then be expecting oil to move back into the $40 a barrel area.

A number of energy strategists have said oil is fundamentally cheap on their models, but let’s make things even simpler. That is, what is one’s view on the USD? This is what trading oil comes down to. As mentioned, trading the USD this week is going to be as tough as many have ever experienced. I am sure you will see people on social media talking about their amazing calls on the USD, but how they fared in the period between the official statement at 6.00am AEDT and during Janet Yellen’s speech will require the trading skills of a currency ninja. Recall, you are competing with some of the most sophisticated word recognition algorithms, stop losses and positioning from all the key market players.
The notion of a ‘Santa Claus’ rally needs to materialise in today’s US trade. On average, over the last 30 years, the market hit a pivot low on 15 December, before averaging a gain of 1.9% into year-end. If this seasonal pattern is to eventuate, then today traditionally marks the start. The start of this seasonal rally occurs on the 16th for Australia and UK, and both markets average 2.2% into year-end. This year is vastly different with the Fed meeting tomorrow, but it’s certainly worth keeping in mind and again puts some weight to my argument of being long risk this week.
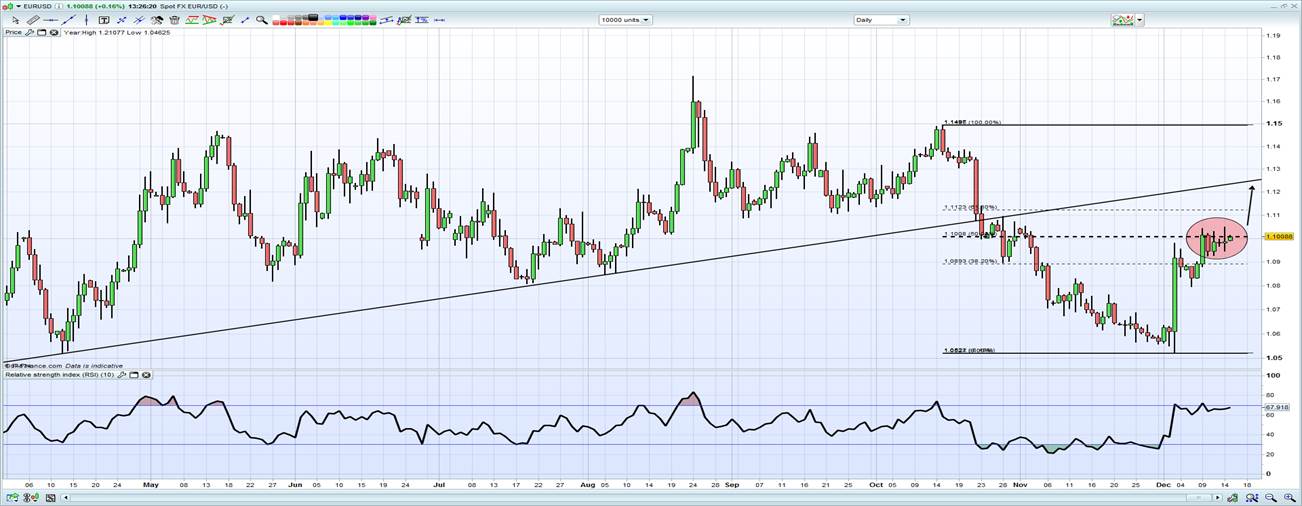
On the point of the USD, I am watching EUR/USD very closely (like everyone else). The pair is consolidating at the 50% retracement of the 9% fall from October to November. With this in mind, I would be a buyer of a break through $1.1042, for a continuation move into the former April uptrend at $1.1230. This may take a narrowing of spreads between US treasuries and German bund, and if the sell-off in US fixed income continues tonight, upside in EUR/USD may be hard to come by.

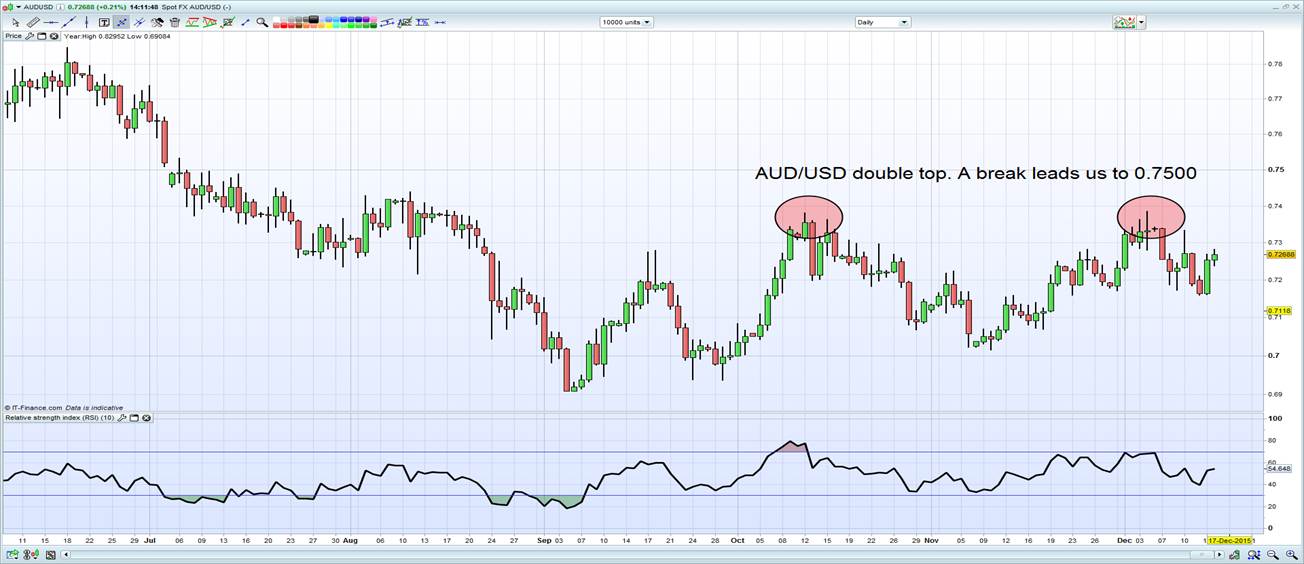
AUD/USD is eyeing a move into the October/December double top at $0.7382/85. Despite some early weakness, traders have been happy to buy, albeit with limited conviction. If the market really does ‘buy the USD, sell the fact’ then one would imagine we will see implied volatility in all asset classes falling with VIX index moving below 20. Look for AUD/USD to break through the double top and into the $0.7500 area where I would then look to fade the pair.

There has been no reaction to the new deficit projections, which at $37.4 billion for 2015/16 are in line with recent speculation. There has been a wider downgrade to future revenues though, but AUD/USD looks firm. I question how many are now watching iron ore and a potential bounce, especially after comments from Rio Tinto (L:RIO) that many of their rivals are hanging on by their fingernails.
