There is a laser-precision technique that tells us whether the precious metals market is going to move higher or lower, and it could take form of a confirmation or invalidation of a major breakout. We just had the make-or-break situation in gold mining stocks, and previously described the HUI Index - flagship proxy for the gold miners - in the following way:
The HUI Index declined significantly, and then it rebounded significantly.
Both are likely linked. Miners first declined more sharply than they did in 2008, so the rebound was also sharper. Based on the stimulus and gold reaching new yearly highs, miners also rallied, and tried to move to new yearly highs. It's not surprising.
However, if the general stock market is going to decline significantly one more time, and so will gold - and as you have read above, it is very likely - then miners are likely to slide once again as well. This would be in tune with what happened in 2008.
At this time, it may seem impossible or ridiculous that miners could slide below their 2015 lows, but that's exactly what could take place in the following weeks. With gold below their recent lows and the general stock market at new lows, we would be surprised not to see miners even below their 2020 lows. And once they break below those, their next strong resistance is at the 2016 low. However, please note that miners didn't bottom at their previous lows in 2008 - they moved slightly lower before soaring back up.
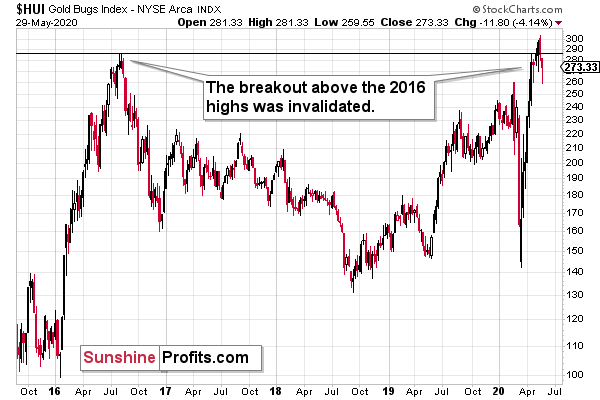
Please note that the HUI Index just moved to its 2016 high which serves as a very strong resistance. Given the likelihood of a very short-term (1-2 days?) upswing in stocks and perhaps also in gold (to a rather small extent, but still), it could be the case that gold miners attempt to rally above their 2016 high and... Spectacularly fail, invalidating the move. This would be a great way to start the next huge move lower.
And what happened last week?

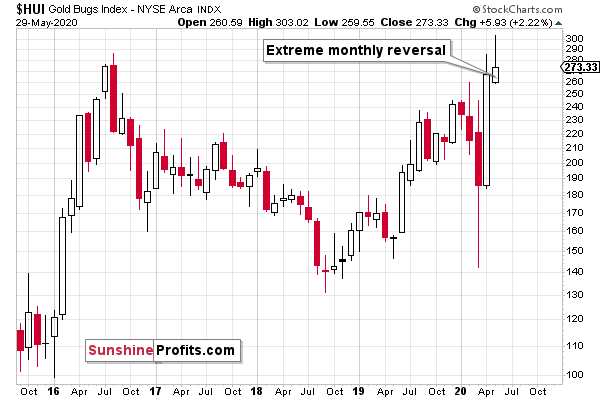
The HUI Index invalidated the breakout above its 2016 high in terms of the weekly closing prices and also in terms of the monthly closing prices.

This is a perfectly bearish sign, especially since the HUI Index has been forming an extremely clear monthly shooting star candlestick. This is a clear formation with clear implications - gold miners are likely to decline in June.

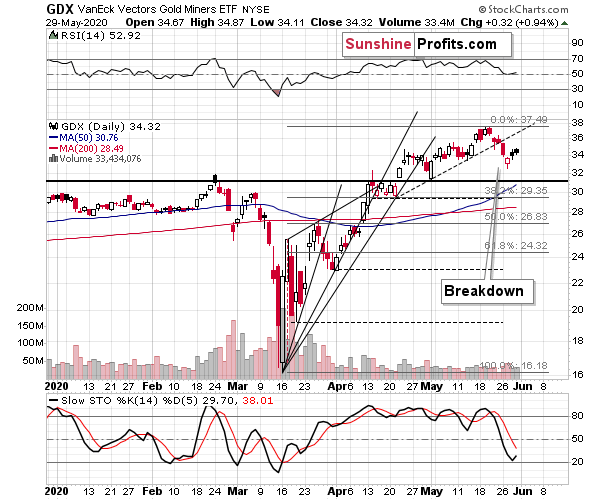
It's important to note that on a daily basis, miners have barely moved higher on Friday. They had a good reason to do so - even two reasons. Both: general stock market and - most importantly - gold / GLD (NYSE:GLD) moved higher so miners should have rallied as well. They didn't, which shows that they are much more likely to decline in the short term instead.
Combining two key gold trading tips: silver's exceptional strength with miners' exceptional weakness provides us with a great trading opportunity.
