Gold for the first time in history records a weekly close above 2000. 'Tis, therefore, fitting that we begin with this iconic passage (courtesy of Jonathon Cape, Gildrose Productions, and Ian Fleming Publications):
"Mr. Bond, all my life I have been in love. I have been in love with gold. I love its colour, its brilliance, its divine heaviness. I love the texture of gold, that soft sliminess that I have learnt to gauge so accurately by touch that I can estimate the fineness of a bar to within one carat. And I love the warm tang it exudes when I melt it down into a true golden syrup. But, above all, Mr. Bond, I love the power that gold alone gives to its owner—the magic of controlling energy, exacting labour, fulfilling one's every wish and whim and, when need be, purchasing bodies, minds, even souls. Yes, Mr. Bond, I have worked all my life for gold and, in return, gold has worked for me and for those enterprises that I have espoused. I ask you," Goldfinger gazed earnestly at Bond, "is there any other substance on earth that so rewards its owner?" --[Ian Fleming, 1959]
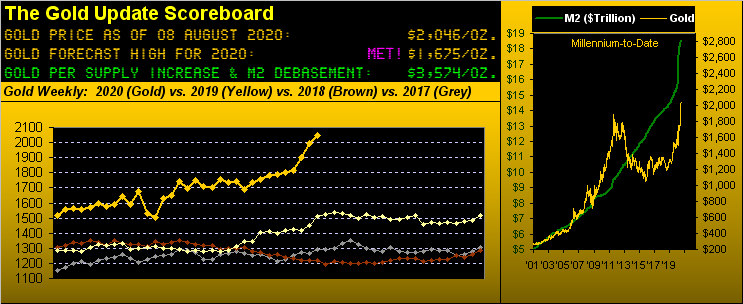
Rewarding, indeed. 61 years following 007 succumbing Goldfinger to playing his golden harp -- and more specifically from 49 years ago following Nixon's nixing of the Gold Standard at $35/oz -- Gold's price has risen to Friday's latest All-Time High of 2089. That's an increase of 5,869%. And in settling out the week at 2046, had it instead so done at the above Gold Scoreboard's valuation of 3574, said the increase would be (for those of you scoring at home) 10,111%. Which reminds us as we teased a week ago, don't miss our Big Announcement at the foot of this week's missive.
As for Sister Silver -- having overwhelmingly outpaced Gold year-to-date (the white metal being net +58% versus the yellow metal being net +35%) -- she has quite-the-less underperformed Gold since 1971. Silver today at 28.40 is but +1,973% from then, (despite having been +3,536% at her own All-Time High of 49.82 back in 2011). Which does beg the question, as wrote in one of our most-valued readers: "How does Silver rocket to $50?", then invoking the Ernest The Hemingway Law of Motion: "First gradually, then suddenly." See both 1979/1980 and 2010/2011. And to a degree this year, for which Silver's low-to-high run from 11.640 on 18 March to 29.915 Friday is a stint of +157%. Moreover, the Gold/Silver ratio has declined from mid-March's 124.2x to 72.0x now. That is just six units above this century's average of 66.0x, a difference not so narrow in better than three years. How many times across that span have we herein queried: "Got Silver?" If you've so had, "Baby you're a rich man, too..."--[BeaTles, '67]
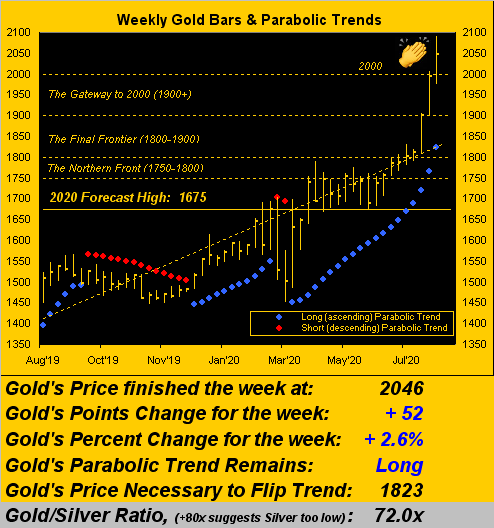
But today we query, "Whither the precious metals?" Obviously any near-term technical study of your choice shows price as well "overbought". But more problematic is that the media -- from its high intelligentsia at the financial level down to its manipulative indoctrination at the mainstream level -- is all over Gold, and even Silver too. And you know what that means: cue the "Nothing Moves in a Straight Line Dept." Indeed in turning to Gold's weekly bars, 'tis been nuthin' but straight up for three straight weeks:
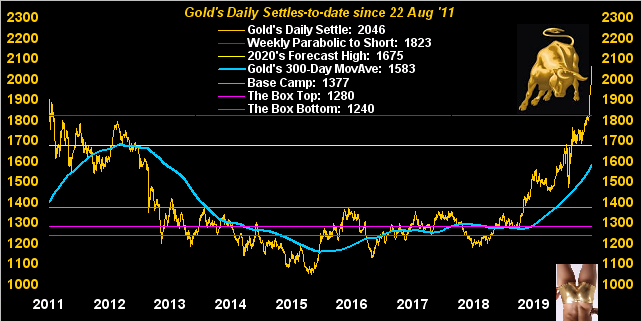
More broadly, here's the daily Gold chart from 2011-to-date for which the Bulls sought, for which the Shorts said would never happen, and for which can never be denied. It simply speaks for itself:
'Course, the S&P 500 across the 49-year span is at present +3,309% (ex-dividends). But as you regular readers know, here is its key valuation complication: in this zero-interest-rate environment with the monetary printing tumblers spinning at full throttle, all that faux dough by working its way into the S&P -- combined with its worst Earnings Season since Q2 of 2009 -- has driven our "live" Price/Earnings ratio up to 53.6x. Which for you WestPalmBeachers down there means that even a 50% market correction would still deem stocks as "expensive". Whereas for Gold, a price run from here of +74% to the Scoreboard's valuation of 3574 would only just bring Gold into parity with currency debasement. The point is: the stock market remains extremely overvalued and Gold extremely undervalued: yes even here at 2046!
"That is NUTS, mmb!" And indeed 'twill in hindsight be so deemed, Squire. The present "live" yield of the S&P 500 is 1.722%; the yield on the U.S. 10-year Treasury Note is 0.562%. Upon those returns crossing as economies come back on line post-COVID, watch out Ms. Marché.
To that point, did you happen to note just a week back that "We always move first" Fitch cut their "outlook" for the U.S. from "stable" to "negative"? That's a boot-shaker, albeit the "AAA" rating was maintained. Seems somewhat oxymoronic, (but perchance these days they're "grading on a curve").
Moreover, or perhaps more moronic (with all due respect), came Federal Reserve Bank of Chicago President Charles Evans' inference that the ball to support the economy is in Congress' court. (What happened to simply allowing the private sector to protectively get back to work?) Remember back upon COVID's arrival that -- if we all just hunkered in our respective bunkers for 14 days -- we'd then know who was infected, the 98.4% balance of the uninfected being able get on with the program? That was a half-year ago, i.e. 13 times as long! The comeupance of such prolonged shutdown? The Stateside money supply at January's end was $15.5 trillion. Today 'tis $18.6 trillion. "Got Gold?"
Meanwhile, Morgan Stanley (NYSE:MS) has determined that the Dollar is the most "oversold" 'tis been in 40 years, a condition which we ourselves do not see in looking at its Index chart. 'Tis -11.1% from this year's high. 'Twas -15.1% from 2017 into 2018; 'twas -41.4% through the century's first eight years. 'Course, a technical result stems from the methodology employed by the analyst. But the Buck ain't that bad: indeed, COVID breeds currency debasement across many borders, even as manufacturing in the EuroZone expanded a tad in July and whilst that in Asia slowed its contraction.
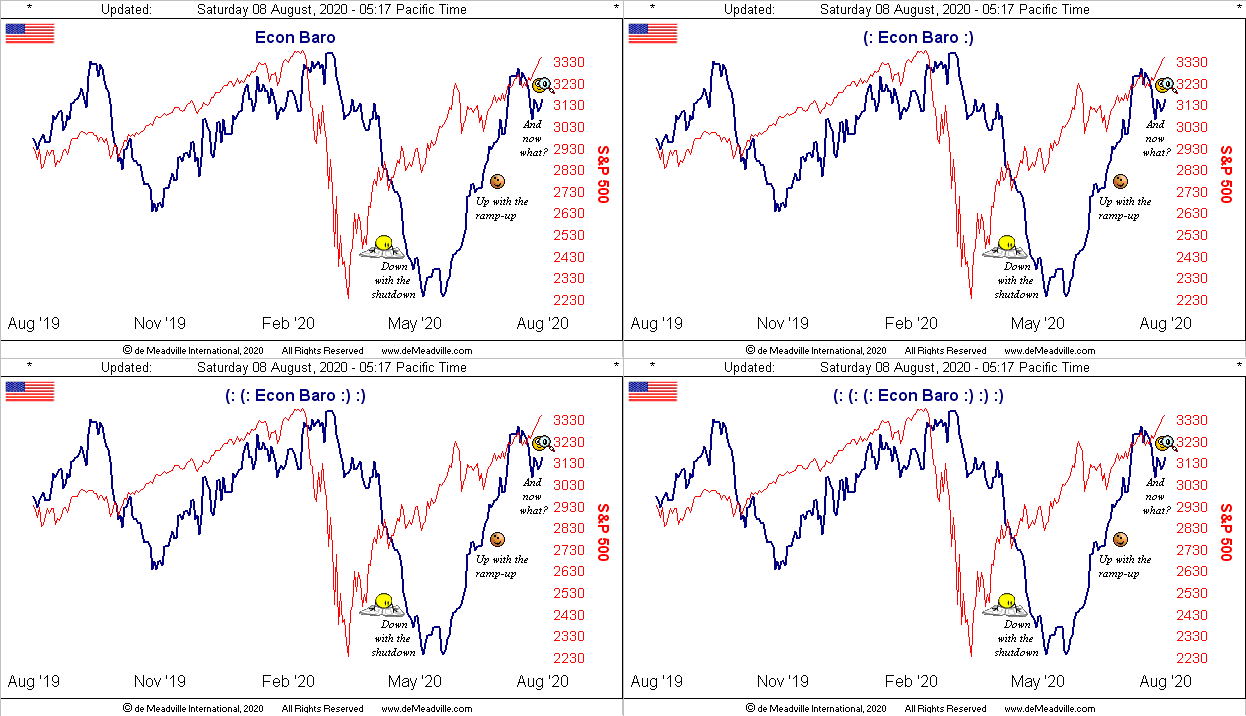
Specific to the StateSide economy came this Convoluted Headline of the Week: "Job Market Recovery Appears to Be Slowing, Services Sector Powering Ahead" (What? Rather reckless Reuters writing there). Either way, the Economic Barometer steadied itself as the week's data unfolded. Notable July highlights included increased Auto Sales and further expansion of the Institute for Supply Management's Manufacturing Index. Here's the Baro:
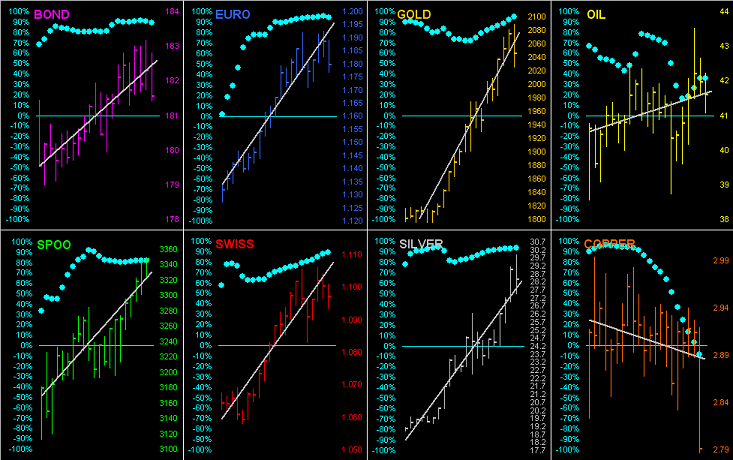
"And now what?" as the above graphic questions is apropos of going 'round the horn for all eight of the BEGOS Markets' respective daily bars from one month ago-to-date, the baby blue dots indicative of each grey trendline's consistency. Note therein the first market to have cracked: economy-leading Copper. Those of you who read the website's daily Prescient Commentary know we've been anticipating the red metal's weakening for nearly two weeks when the "Baby Blues" first came unglued. With which comes this tough trading theorem: "'Tis great to be early ... if can weather adversity." (Hence our jumping and down all these years about prudent cash management). Which component is next on the cracking list? Oil's uptrend consistency appears anything but:
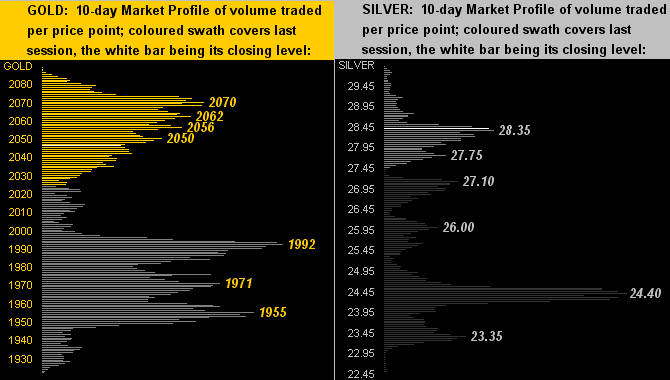
As for the precious metals' near-term support/resistance guidance, here next are the 10-day Market Profiles for Gold on the left and Silver on the right. That's quite a rash of resistive overhead apices above Gold's present level, whereas Silver's stance appears better supported. 'Course, having a feel for trading range, too, is important. At this writing, Gold's expected daily trading range is 40 points and the weekly is 74 points. For Silver, those measures are 1.65 points and 2.05 points respectively. Thus into your Osterizer put support, resistance, range, a dash of bitters, and you'll be a tradin' sensation! Well, maybe...
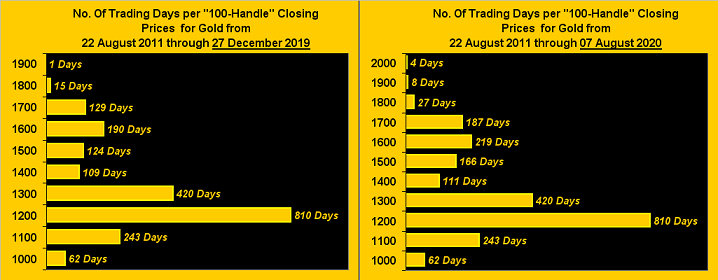
Finally, let's update our graphic of Gold's closing prices by their "100 Handle" since August 2011. At left, we see that as of last December, Gold had closed but one day indeed precisely at 1900 those nine years ago. At right, we see the continued progress since December, Gold's having raced right up through the 1800s and 1900s, with closes above 2000 now for four days. One gets the sense that never again -- at least in our lifetimes -- shall we see Gold sub-1600:
And so, as promised to our Big Announcement:
■ Following The Gold Update Edition No. 100 (15 October 2011) we stated we'd keep writing through Edition No. 200 or Gold 2000, whichever came first;
■ Come Edition No. 200 (14 September 2013) came also your humbling emails to have us keep going;
■ Then Edition No. 559 (01 August 2020) of a week ago encompassed Gold's having finally tapped 2000 ... again with which came more emails;
■ But therein, we'd dropped a hint as follows: "We can now wipe our hands and say 'Our job is done here.'";
■ So did you catch that "can" was purposely selected as that sentence's key word, for it implies ability vs. being absolute;
■ Moreover, since we go on week-in and week-out -- notably per the opening Gold Scoreboard -- about just how undervalued Gold is relative to the debasing Dollar -- let's face it: 'twould be the height of hypocrisy for us to bail out now. Right? You bet yer derrière 'twould be!
■ Therefore, (drum-roll please): we shall stay the course* of these weekly missives until such time Gold catches up to its Dollar debasement value, which as aforementioned is 74% above the current 2046 price at 3574. Cue trumpet fanfare ...
* lest we depart this veil of tears mentally, financially, or physically.
Which means we'll see you next week per usual in continuing to track the success of Gold through the 2000s, and Beyond!!!