What were you doing in June 2006?
That’s when the Federal Reserve last raised interest rates, just a year after the last Star Wars flick hit theaters. The biggest movie at the time was Adam Sandler’s “Click,” the hottest song, Shakira’s “Hips Don’t Lie.” The best-performing S&P 500 Index stock for the month was CH Robinson Worldwide Inc (O:CHRW). And as for Janet Yellen, she was president of the Federal Reserve Bank—of San Francisco.
If June 2006 doesn’t seem that long ago, consider this: Up to a third of asset managers working today have never experienced a rate hike professionally.
On Wednesday, Chair Yellen announced that, for the first time in seven years, easy money will become slightly less easy. The target rate will be set at between 0.25 and 0.50 percent, which doesn’t sound like much, but it’s important that the Fed ease into this cycle cautiously and gradually. Plus, this comes at a time when fellow industrialized nations and economic areas around the globe are considering further monetary easing measures.
Effects and Possible Ramifications: Keep Calm and Invest On
Rising rates, of course, have a noticeable effect on mortgages, car loans and other forms of credit. Savers will finally start earning interest again.
The question on investors’ minds, though, is what effect they might have on their investments. After all, the last couple of days have been challenging for stocks, with the S&P 500 dropping 1.5 percent on Friday alone. Is the Fed decision to blame?
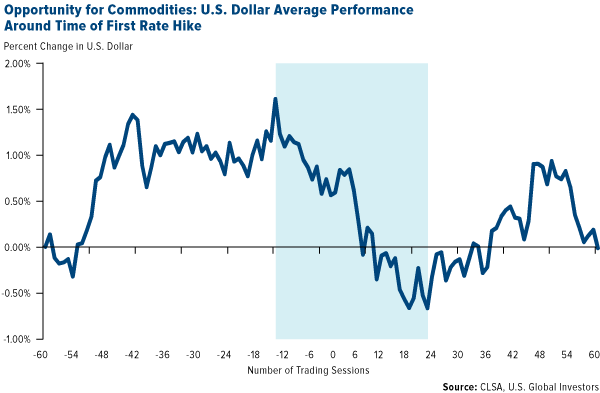
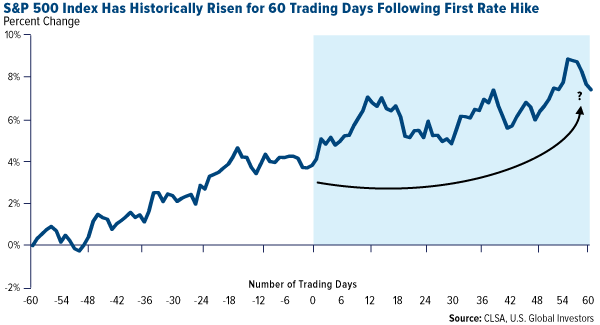
To answer this, CLSA analyzed what happened to the U.S. dollar and stocks in the S&P 500 Index 60 trading days before and after the initial rate hike in past cycles and then calculated the averages. It’s important to keep in mind that, aside from rising interest rates, a multitude of unique factors—from geopolitics to economic conditions to the weather—played roles in influencing the outcomes. Nevertheless, CLSA’s research is instructive.
The group finds that, on average, the U.S. dollar peaked 10 trading days before the rate hike, and then afterward slid lower for four to five weeks. This created an agreeable climate for gold and other precious metals and commodities, as their prices typically share an inverse relationship with the dollar.

As for equities, they traded up for 60 trading days following the initial rate hike, 70 percent of the time.

But CLSA’s analysis looks only at possible near-term scenarios. What about the long-term?
In the past, the results were just as reassuring—most of the time. Barron’s records S&P 500 returns 250 and 500 days following the initial rate hike in six monetary tightening cycles going back to 1983. The findings suggest that the market went through an adjustment period, with average returns falling from 14 percent before the rate hike to 2.6 percent 250 days afterward. But by 500 days, returns returned to their pre-hike average of around 14 percent.
Equities Survived Previous Fed Rate Hikes
Again, many other factors besides interest rates contributed to market behavior in each instance. And this time is especially different, as the market was given an unusually long runway, allowing it to price in the full effects of the liftoff before it finally happened.
I can’t say whether the same trajectory will be taken this time as before, but what CLSA, Barron’s and others have found should be encouraging news for commodities and stocks.
I should also point out that according to the presidential election cycle theory developed by market historian Yale Hirsh, markets do well in a presidential election year.
The consumer price index came out this week and, with an inflation rate of 2 percent, the 5-year Treasury yield is now negative. (The real interest rate is what you get after subtracting inflation from the 5-year government bond.) This bodes well for gold. Also, the 10-year bond yield is lower than it was six months ago.
Investors Flee Junk Bonds and Defaulting Energy Companies, Find Comfort in Tax-Free Muni Bonds
In 2008, the Fed trimmed rates to historically-low levels in response to the worst financial crisis since the 1930s. Most people would agree that this helped put the brakes on the U.S. slipping further into recession.
But low rates were also partially responsible for driving many investors into riskier investments over the last few years—corporate junk bonds among them—as they sought higher yields.
Junk bonds, or high-yield bonds, are known as such because they have some of the lowest ratings from agencies such as Moody’s and Standard & Poor’s. Because they carry a higher default risk than investment-grade bonds, they offer higher yields.
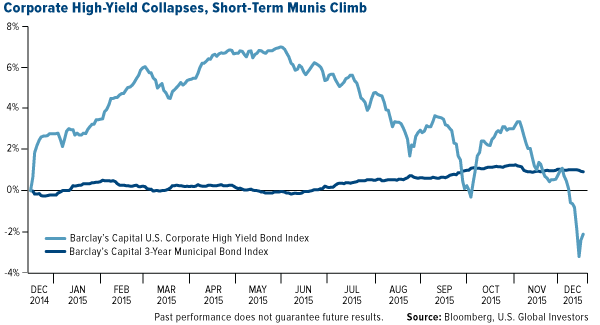
But with corporate default rates nearing 3 percent for the year, and at least one large high-yield bond fund cutting off all redemptions, investors are facing liquidity problems and learning the hard way why these equities are commonly called “junk.”
The week before last, it was announced that a high-yield bond fund—whose assets under management were worth $2.5 billion as recently as 2013—would be closing after suffering nearly $1 billion in outflows this year. This sent the junk bond market into panic mode, with several similar funds experiencing near-record outflows. Fears intensified when legendary investor Carl Icahn tweeted: “Unfortunately I believe the meltdown in High Yield is just beginning.”
To make matters worse, high-yield bonds have fallen into negative territory, giving investors little reward for the risk.

Energy companies, highly leveraged since oil began to spill value in the summer of 2014, top the default list for the year.
JPMorgan estimates that the industry’s overall default rate might hit 10 percent next year.
“Junk bonds will likely be dead money for at least several years,” says Tony Daltorio, writing for Wyatt Investment Research. “Put your money elsewhere.”
But where, exactly, is “elsewhere”?
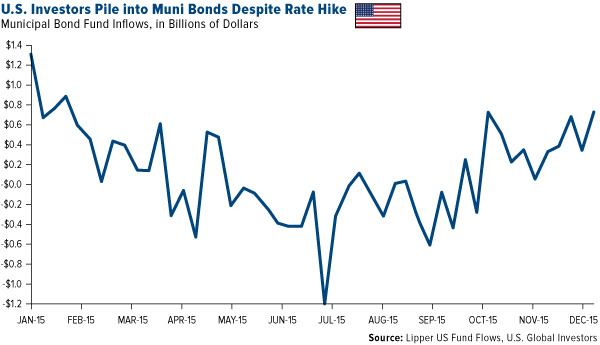
With rates now on the rise, many investors have turned to investment-grade, short-term municipal bonds, which have seen inflows at the fastest pace since January.

Savvy investors know that bond prices move in the opposite direction of interest rates, but shorter-term munis are less sensitive to rate fluctuations than longer-term bonds. Put another way, bonds that are more sensitive to changes in the interest rate environment will have greater price fluctuations than those with less sensitivity.
“As municipal bonds head toward the strongest returns in the U.S. fixed-income markets this year, investors say the end of near-zero interest rates will do little to knock state- and local-government debt off its stride,” Bloomberg writes.
Over the past seven years, low rates certainly contributed to one of the strongest bull markets in U.S. history. Now that easy money is coming to an end, we can expect to see more volatility. But as the CLSA and Barron’s data show, there’s still plenty of room for growth.
It’s important, therefore, to stay diversified. Focus on high-quality, dividend-paying stocks; investment-grade, short-term municipal bonds; and, as always, gold—five percent in gold stocks, the other five percent in bullion.
U.S. Global Investors, Inc. is an investment adviser registered with the Securities and Exchange Commission ("SEC"). This does not mean that we are sponsored, recommended, or approved by the SEC, or that our abilities or qualifications in any respect have been passed upon by the SEC or any officer of the SEC.
This commentary should not be considered a solicitation or offering of any investment product.
Certain materials in this commentary may contain dated information. The information provided was current at the time of publication.
Some links above may be directed to third-party websites. U.S. Global Investors does not endorse all information supplied by these websites and is not responsible for their content. All opinions expressed and data provided are subject to change without notice. Some of these opinions may not be appropriate to every investor.
The S&P 500 Stock Index is a widely recognized capitalization-weighted index of 500 common stock prices in U.S. companies. The U.S. Corporate High-Yield Index covers the USD-denominated, non-investment grade, fixed-rate, taxable corporate bond market. Securities are classified as high-yield if the middle rating of Moody’s, Fitch, and S&P is Ba1/BB+/BB+ or below. The index excludes emerging markets debt. The Barclay's 3-Year Municipal Bond Index is a total return benchmark designed for short-term municipal assets. The index includes bonds with a minimum credit rating BAA3, are issued as part of a deal of at least $50 million, have an amount outstanding of at least $5 million and have a maturity of 2 to 4 years.
The Consumer Price Index (CPI) is one of the most widely recognized price measures for tracking the price of a market basket of goods and services purchased by individuals. The weights of components are based on consumer spending patterns.
There is no guarantee that the issuers of any securities will declare dividends in the future or that, if declared, will remain at current levels or increase over time.
None of U.S. Global Investors Funds held any of the securities mentioned in this article as of 9/30/2015.
