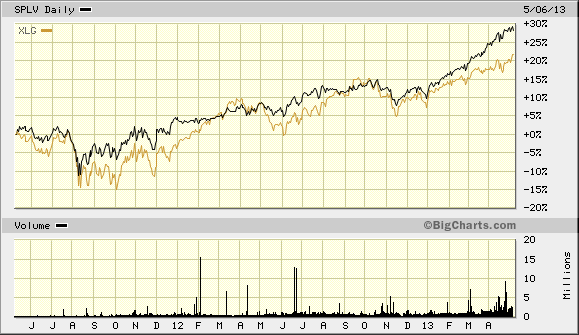
Right now, the good folks at Morningstar view Low Volatility ETFs as too expensive. The analysts at the investment evaluation giant believe that investors should focus on mega-cap brand name corporations instead — companies that may have more reasonable prices relative to earnings and/or fair value estimates.
Mega-cap ETFs include assets like Guggenheim Russell Top 50 (XLG) as well as Vanguard Megacap (MGC). Both have performed admirably over the course of the last two years. On the other hand, low volatility funds like PowerShares S&P 500 Low Volatility (SPLV) and iShares Minimum Volatility (USMV) are capturing more in the way of capital appreciation as well as the investing public’s imagination.
It is true that low volatility funds are heavy on non-cyclical economic sectors like utilities, consumer staples and health care. It is also true that the current price-to-earnings (P/E) in the segments are higher than their respective historical norms. Yet this argument ignores a variety of other factors that influence the demand for certain types of assets… from quantitative easing to comparable yield spreads to declining economic growth to technical trends to asset volatility.
Perhaps ironically, Morningstar’s Michael Rawson may have inadvertently thrown a bone to the “low vol” defense. In seeking to bolster Morningstar’s case for Mega-cap ETFs like XLG, the writer expressed that the Russell Top 50 Index was only modestly less volatile than the S&P 500. Its annualized return since 2002 was 3.2% whereas the S&P 500 was 4.9%. Yet here’s where the news gets even more impressive. The S&P 500 Low Volatility Index that SPLV is based upon compounded at 8.6%… and was roughly 1/3 as volatile than the Russell Top 50 Index that XLG tracks.
Before going any further, let’s translate what this means… both financially and emotionally. An investor with $250,000 in the equivalent of the Russell Top 50 Index over the last 11 years experienced enormous price swings on route to $354,000. An investor with $250,000 in the equivalent of the S&P 500 Low Volatility Index over the last 11 years recorded $620,000 with a fraction of the roller-coaster ride that has defined U.S. equities in the current century.
$620,000 versus $354,000? 1/3 the risk? Why is it sensible to push funds like PowerShares S&P 500 Low Volatility (SPLV) and iShares Minimum Volatility (USMV) away from the portfolio table based on historical price-to-earnings (P/E) or price-to-proprietary-fair-value (P/FV) alone?
Granted, the future is not going to be the same as past. Nevertheless, let me add yet another wrinkle… the bond market. If one looked at U.S. treasuries in a similar vacuum as Morningstar’s one-track fundamental stock analysis, one could make a case that iShares 7-10 Year Treasury (IEF) is ripe for bearish losses of -30%. However, globally coordinated quantitative easing by central banks accompanied by a high demand for perceived safety keeps the 10-year from reverting to a mean historical yield of 4.75%.
My point is not to say that bond valuation and stock valuation involve the same process or metrics. Rather, neither asset type is likely to move on “book-wormy” valuation alone. In fact, both non-cyclical heavy stock ETFs like SPLV and USMV as well as treasury bond ETFs like iShares 7-10 Year Treasury (IEF) owe larger-than-life inflows and exceptional price gains to a perception of safety as well as quantitative easing. In other words, valuation “shmowluation!”
By the way, I have nothing against Mega-Cap ETFs whatsoever. I feel that ETFs like Vanguard Mega-Cap (MGC) and Vanguard Mega-Cap Growth (MGK) are worthy of buying on the next 8%-10% pullback.
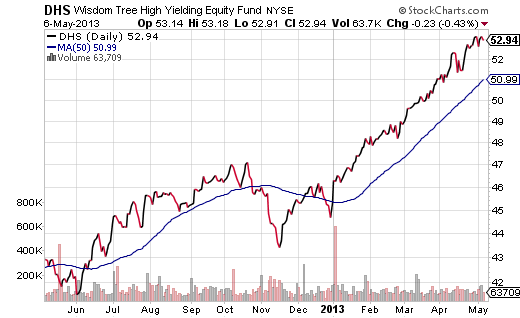
Nevertheless, for those portfolios that haven’t benefited from equity income stand-outs like WisdomTree Equity Income (DHS) or PowerShares S&P 500 Volatility (SPLV) in the past, your opportunity is coming. A 50-day trendline could serve as an entry point or you could wait for a 5%-6% sell-off. 
Disclosure: Gary Gordon, MS, CFP is the president of Pacific Park Financial, Inc., a Registered Investment Adviser with the SEC. Gary Gordon, Pacific Park Financial, Inc, and/or its clients may hold positions in the ETFs, mutual funds, and/or any investment asset mentioned above. The commentary does not constitute individualized investment advice. The opinions offered herein are not personalized recommendations to buy, sell or hold securities. At times, issuers of exchange-traded products compensate Pacific Park Financial, Inc. or its subsidiaries for advertising at the ETF Expert web site. ETF Expert content is created independently of any advertising relationships.
- English (UK)
- English (India)
- English (Canada)
- English (Australia)
- English (South Africa)
- English (Philippines)
- English (Nigeria)
- Deutsch
- Español (España)
- Español (México)
- Français
- Italiano
- Nederlands
- Português (Portugal)
- Polski
- Português (Brasil)
- Русский
- Türkçe
- العربية
- Ελληνικά
- Svenska
- Suomi
- עברית
- 日本語
- 한국어
- 简体中文
- 繁體中文
- Bahasa Indonesia
- Bahasa Melayu
- ไทย
- Tiếng Việt
- हिंदी
The Evidence Still Favors Low Volatility ETFs
Published 05/07/2013, 02:37 AM
Updated 03/09/2019, 08:30 AM
The Evidence Still Favors Low Volatility ETFs
3rd party Ad. Not an offer or recommendation by Investing.com. See disclosure here or
remove ads
.
Latest comments
Install Our App
Risk Disclosure: Trading in financial instruments and/or cryptocurrencies involves high risks including the risk of losing some, or all, of your investment amount, and may not be suitable for all investors. Prices of cryptocurrencies are extremely volatile and may be affected by external factors such as financial, regulatory or political events. Trading on margin increases the financial risks.
Before deciding to trade in financial instrument or cryptocurrencies you should be fully informed of the risks and costs associated with trading the financial markets, carefully consider your investment objectives, level of experience, and risk appetite, and seek professional advice where needed.
Fusion Media would like to remind you that the data contained in this website is not necessarily real-time nor accurate. The data and prices on the website are not necessarily provided by any market or exchange, but may be provided by market makers, and so prices may not be accurate and may differ from the actual price at any given market, meaning prices are indicative and not appropriate for trading purposes. Fusion Media and any provider of the data contained in this website will not accept liability for any loss or damage as a result of your trading, or your reliance on the information contained within this website.
It is prohibited to use, store, reproduce, display, modify, transmit or distribute the data contained in this website without the explicit prior written permission of Fusion Media and/or the data provider. All intellectual property rights are reserved by the providers and/or the exchange providing the data contained in this website.
Fusion Media may be compensated by the advertisers that appear on the website, based on your interaction with the advertisements or advertisers.
© 2007-2024 - Fusion Media Limited. All Rights Reserved.
