When an asset class (e.g., stocks, bonds, commodities, real estate, collectibles, etc.) skyrockets in price – when it surges higher without sufficient economic reason – a bubble develops. Technology stocks in the late 1990s. Housing in the mid-2000s. When the asset class inevitably nose-dives? The balloon implodes.
Speculative silliness has not been difficult for me to spot. As a national talk radio personality in the late 1990s, I warned stock investors not to get carried away by dot-com madness. A “New Economy?” More like a new catchphrase. As a financial blogger with a popular web site in the mid-2000s, I cautioned readers not to get caught up in property price insanity. Forty percent more to own than rent? Absurd.
Of course, identifying a bubble is not the same as quantifying one. If the identification is going to have meaning, there needs to be a way to measure the magnitude of a financial blister.
With respect to market-based securities, at least, Grantham Mayo Van Otterloo & Company (GMO) researched 40 bubbles and discovered that prices surpassed two standard deviations on each occasion. More telling, asset prices reverted back to long-term averages in every circumstance. Based on their research, the money management firm defined a bubble as a “two standard deviation” occurrence.
The problem with the two standard deviation story? A financial blob can get even larger before it bursts. Or it may act more like an unsightly cyst, biding time and waiting for something or someone to drain it.
Perhaps not surprisingly, GMO’s Jeremy Grantham has started to doubt his own understanding of stock market bubbles. In a recent interview with the Wall Street Journal, he described the current environment as “decently different” from other 2-sigma events. His reasoning? An absence of euphoria.
Granted, my dentist isn’t asking me about plopping a big chunk of his Rollover IRA dollars into Snap Inc (NYSE:SNAP). That said, investor equity allocation at 67.5% is near other speculative tops of 70% at a time when stock valuations are two standard deviations above the mean.
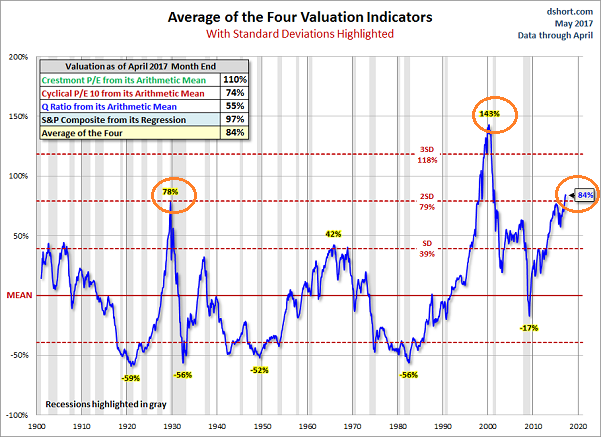
Aren’t GMO’s original findings (i.e., two standard deviations) powerful enough on their own? Might an investor want to take a little less risk when traditional valuations are pushing rarefied air? Or should one ignore the mathematical signs until anecdotal evidence of frenzy appear?
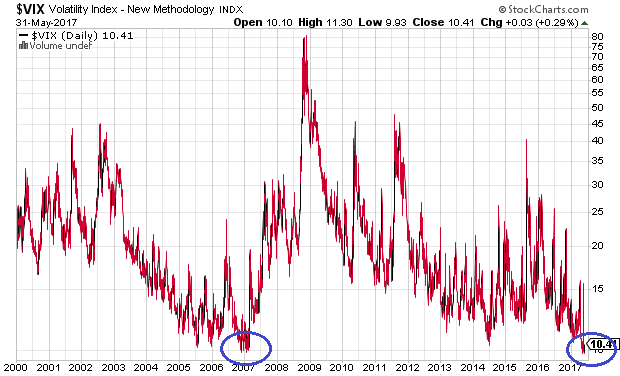
Keep in mind, it’s not as if jubilation has been missing altogether. The Conference Board’s Consumer Confidence Survey hit a 15-year high in February (114.8). Meanwhile, the CBOE Volatility Index (VIX) – often called the “fear gauge” – has been registering 21st century lows. The upbeat consumer, the lack of fear via the VIX (10) and the elevated investor allocation to stock (67.5%) may be a bit more euphoric than Grantham recognizes.
Here’s another reason to rethink the whole euphoria notion: real estate. For the 4th straight year, Gallup found that Americans strongly favor real estate over competing long-term investments (i.e., savings/CDs, gold, bonds, stocks/mutual funds). That lines up relatively well with clients whom I speak with regularly. Indeed, anecdotally speaking, more people are talking about their real estate net worth than their 401k balances.
So if euphoria were the key element in speculative balloons, wouldn’t soaring property values alongside giddy investors imply a foamy real estate market? The evidence, however, suggests otherwise.
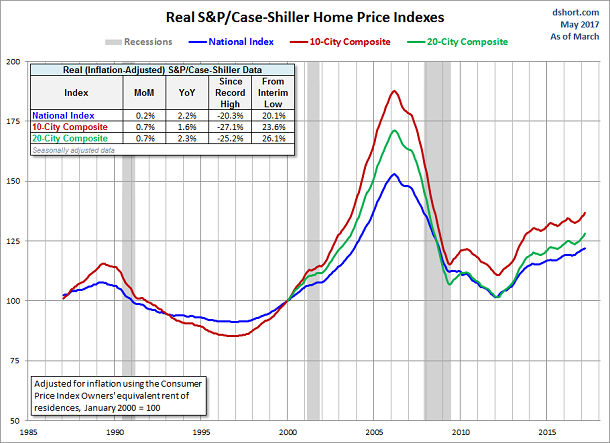
Consider inflation-adjusted housing via the S&P/Case Shiller Home Price Index. The “real” property bubble that escalated out of control in the mid-2000s and that preceded the prior recession (12/07-5/09) exists in stark contrast to current conditions.
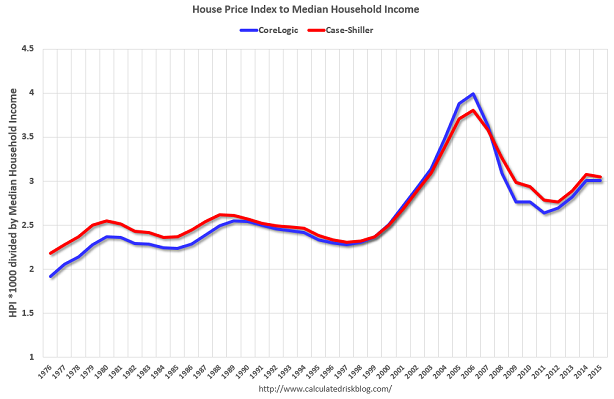
Another way to look at the data is to compare nominal home prices to nominal household income (median). The average ratio for the quarter century that preceded the parabolic housing boom (2001-2006) was 2.4. At the 2006 top? 4.0. Here in 2017, with the Home Price Index at 186.95 (x 1000) and median household income at $59,361 (April), the ratio is 3.1. A strong case can be made that home prices are overvalued. Nevertheless, prices remain far below the “bubblicious” peak in 2006.
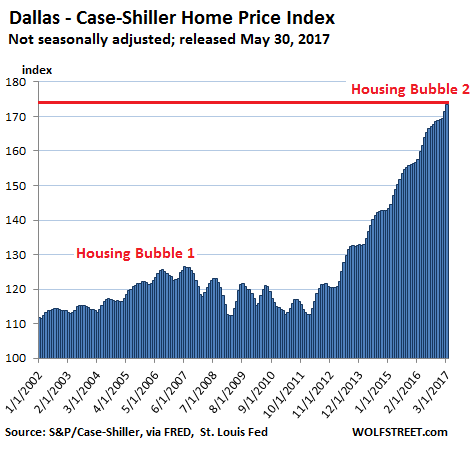
Sure, there’s the senselessness of Silicon Valley in San Jose and there’s a boom in job friendly Texas. Wolf Richter demonstrates the changes between the housing bubble of mid-2000 and housing prices today in Dallas in the chart below. And while the data is NOT adjusted for inflation, adjusting for the real value of dollars (17%) still would not justify the price surge occurring in some areas of the country. What’s more, Richter wonders aloud if a housing bubble only exists when an inflation-adjusted point that destroyed the financial system has been surpassed.
Overvalued real estate or bubbly real estate, I believe that U.S. stocks have far more in common with champagne. If the long-term average valuation (PE10) for the stock market is 16.5, then today’s PE10 of 29.5 represents two standard deviations. The two-sigma event can be seen across several other important indicators, including price-to-sales (P/S) as well as market cap-to-GDP (a.k.a. “The Warren Buffett Indicator.”)
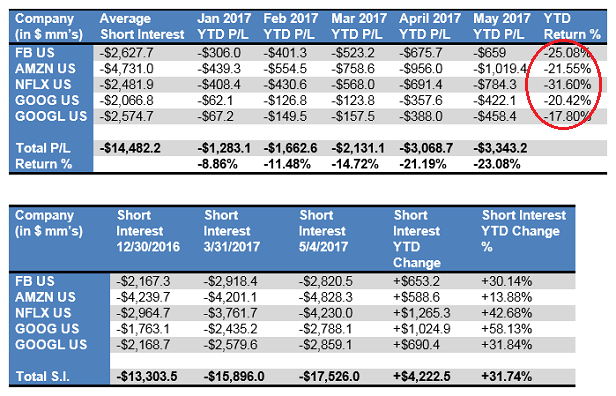
Moreover, there’s plenty of stock market euphoria in Facebook (NASDAQ:FB), Amazon (NASDAQ:AMZN), Netflix (NASDAQ:NFLX) and Alphabet (NASDAQ:GOOGL) Inc C (NASDAQ:GOOG). Those who have dared to bet against their unstoppable rise have been mutilated. How does GMO’s Grantham square the apparent unconstrained ardor for “FANG” stocks?
Without question, the stock market is more worrisome than real estate. Nearly one-third of Russell 2000 companies have posted negative earnings for the last 12 months. Meanwhile, even the notion that larger corporations are remarkably profitable is flawed. S&P 500 GAAP earnings per share came in at $100.4 in the first quarter of 2017. The S&P 500 trades at 2420. Yet S&P 500 GAAP earnings were slightly better at $100.85 three years ago at this time, and the index traded at 1960.
In essence, the S&P 500 has risen 23.5% over three years from an elevated P/E of 19.4 to a stratospheric P/E of 24.5 on zero earnings growth. And that is not indicative of euphoria? Perhaps one would like to point to interest rates. The 10-year yield was roughly 2.5% at this point in 2014; the 10-year yield is approximately 2.25% now. Clearly, there is no meaningful differences in stimulus to suggest ultra-low borrowing costs justify the ascent.
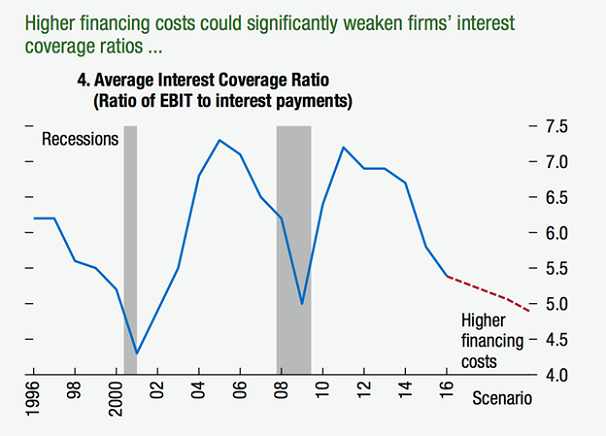
Truthfully, corporate debt is an issue that deserves more attention as well. The current corporate-debt-to-GDP ratio at 45%-plus sits near the same record high leverage that preceded the three previous recessions. Equally worth of note, corporate capacity to meet its interest payments continues to fade. The fact that declining interest coverage ratios preceded the last two recessions, alongside Fed withdrawal of monetary stimulus, hardly paints a pretty picture going forward.
Even members of the Federal Reserve Open market Committee see trouble on the horizon. Recent meeting minutes revealed the members sense that “equity prices are quite high relative to standard valuation measures.” Yes, quite. Not that they’d call it a bubble or even dream about pricking its surface for fear of causing a stampede for the exits.
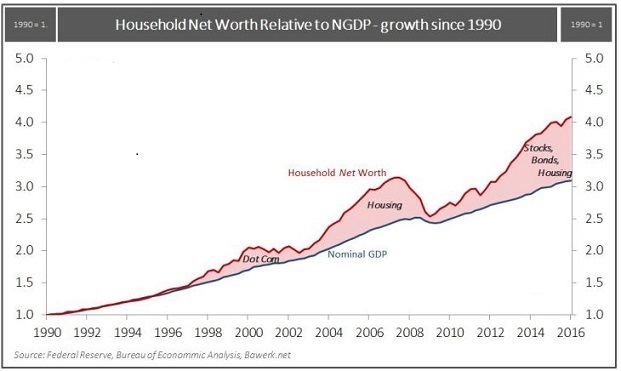
Perhaps most vexing is the reality that, over longer periods of time, financial assets cannot grow up and above economic growth indefinitely. Neither can debt. Yet both the growth rate for credit (a.k.a. debt) as well as the growth rate for key financial assets (e.g., stocks, bonds, real estate, etc.) have far surpassed the expansion of our economy via our gross domestic product (GDP). And it simply will not last.
The fact that I have had a lower allocation to stock (50%) than normal (70%), as well as a higher allocation to cash equivalents (25%) than normal (0%-5%), has been trying since the beginning of 2015 (12/18/2014). Far more so since the election, of course. Prior to the election, the S&P 500 suffered two 10%-plus corrections and failed to make price progress over a 22-month period (12/19/2014-10/18/2016).
Nevertheless, there are times when waiting for future opportunities in cash and/or preserving capital are more critical than shorter-term victories. As Tom Petty sang, “The waiting is the hardest part.” It may very well be. Yet ultimately, patience pays out some of the best dividends that investing has to offer.
Disclosure Statement: ETF Expert is a web log (“blog”) that makes the world of ETFs easier to understand. Gary Gordon, MS, CFP is the president of Pacific Park Financial, Inc., a Registered Investment Adviser with the SEC. Gary Gordon, Pacific Park Financial, Inc., and/or its clients may hold positions in the ETFs, mutual funds, and/or any investment asset mentioned above. The commentary does not constitute individualized investment advice. The opinions offered herein are not personalized recommendations to buy, sell or hold securities. At times, issuers of exchange-traded products compensate Pacific Park Financial, Inc. or its subsidiaries for advertising at the ETF Expert website. ETF Expert content is created independently of any advertising relationship.
